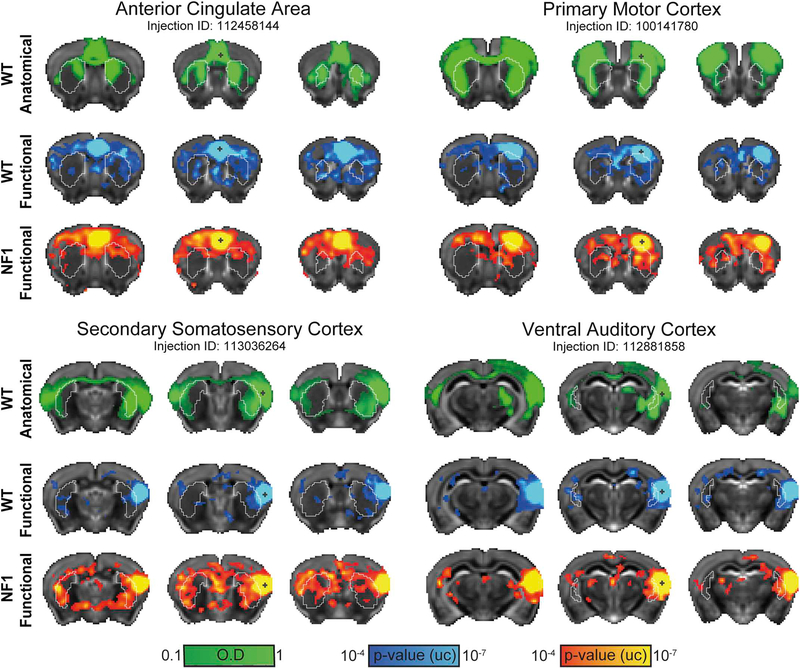
Fig. 5.
Functional and anatomical corticostriatal connectivity in the mouse brain. Qualitative comparisons between optical density maps (green) representing anatomical connectivity, and statistical parametric maps (p < .0001, voxel extent ≥ 5, uncorrected) representing positive functional connectivity correlations in WT (blue-light blue) and NF1 (red-yellow) mice, are presented for four cortical regions. Overlapping corticocortical and corticostriatal connections can be observed in WT but to a lesser extent in NF1. The parametric maps are overlaid on a downsampled version of the Allen Mouse Brain Atlas that matches at the original fMRI resolution. (For interpretation of the references to colour in this figure legend, the reader is referred to the web version of this article.)

