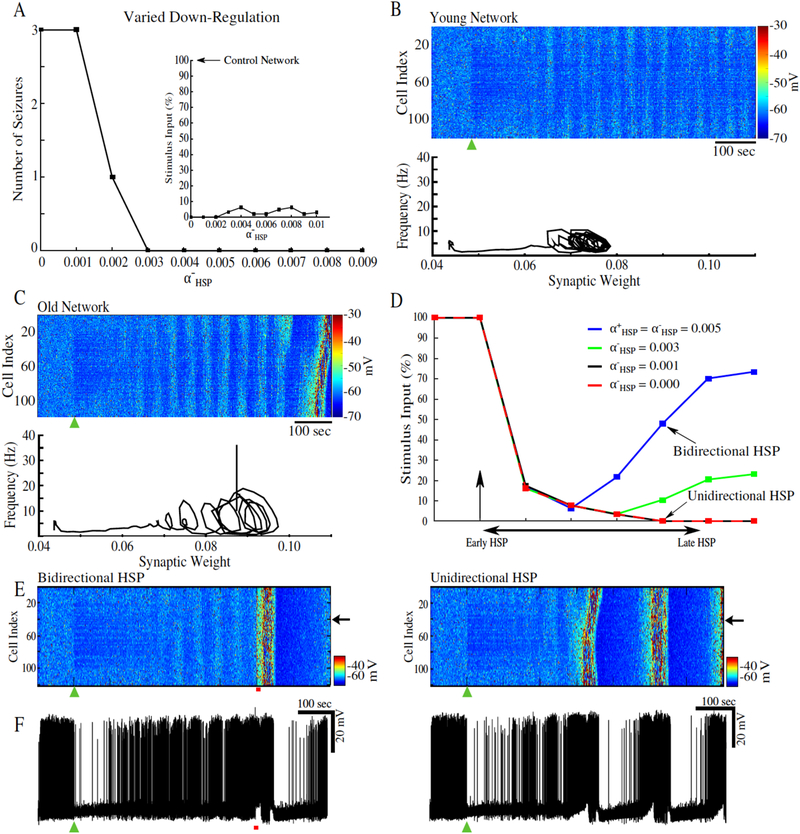
Figure 3.
Impaired bidirectionality of HSP may underlie age-dependent differences in seizure susceptibility. Partial deafferentation was applied to the computational model at 100 sec (black arrow or green triangle). A, Number of spontaneous seizures as a function of the HSP down-regulation rate, α−HSP. Inset shows the seizure thresholds for networks with different α−HSP. B, Top, Heatmap of activity of a network with α−HSP = 0.009. Bottom, firing rate – synaptic strength phase space projection showing effects of network deafferentation. Inset, amplitude of the steady-state oscillation in the phase space projections for values of α−HSP = 0.003 – 0.01; note these HSP rates did not produce spontaneous seizures. C, Top, Heatmap of the network activity for α−HSP = 0.002. Bottom, firing rate – synaptic strength phase space projection leading to seizure. D, Time evolution of seizure threshold for networks with varying α−HSP All networks implemented synaptic sprouting; vertical arrow indicates the time of partial deafferentation. E, Heatmap of the network activity with bidirectional HSP (left), and unidirectional HSP (right). F, Corresponding single neuron activity from the networks in E. This figure is adapted from (González etal., 2015).

