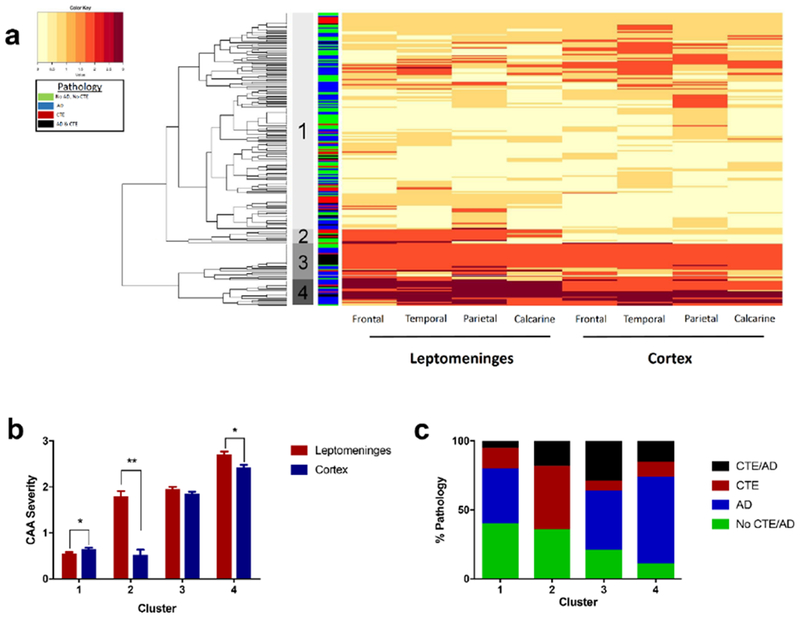
Figure 1: Distribution of cerebral amyloid angiopathy by hierarchical cluster algorithm.

a) An unbiased hierarchical cluster heatmap shows the distribution and severity of CAA in all participants with CAA and without missing data (n=222). The orange color scale indicates the semi-quantitative severity of CAA (0-3). The four major clusters are indicated by the shaded gray bars to the right of the dendrogram. Pathologic diagnoses are shown in the adjacent green (No AD/CTE), blue (AD), red (CTE), and black (AD & CTE) colored column and in panel C. b) The mean severity of CAA across all regions is shown for each cluster in both the leptomeningeal (red) and cortical (blue) vessel compartments. Analysis of the clusters using a mixed linear mixed effects model showed that cluster 2 had significantly more severe disease in the leptomeninges across all regions compared to the cortex (**p <0.001). Cluster 4 and cluster 1 also showed significant differences (*p=0.001) but had much smaller mean differences than cluster 2. c) The composition of the clusters differed significantly by pathology (p<0.001; χ2 analysis). The proportion of individuals with CTE was significantly higher in Cluster 2 compared to cluster 1 and cluster 4 (p <0.001). Cluster 1 and cluster 4 had a significantly higher percentage of individuals with AD than cluster 2 (p <0.001). There was no difference in the proportion of No CTE/No AD individuals throughout the clusters and the only significant difference in CTE & AD individuals was between clusters 1 and 3 (p <0.001).
