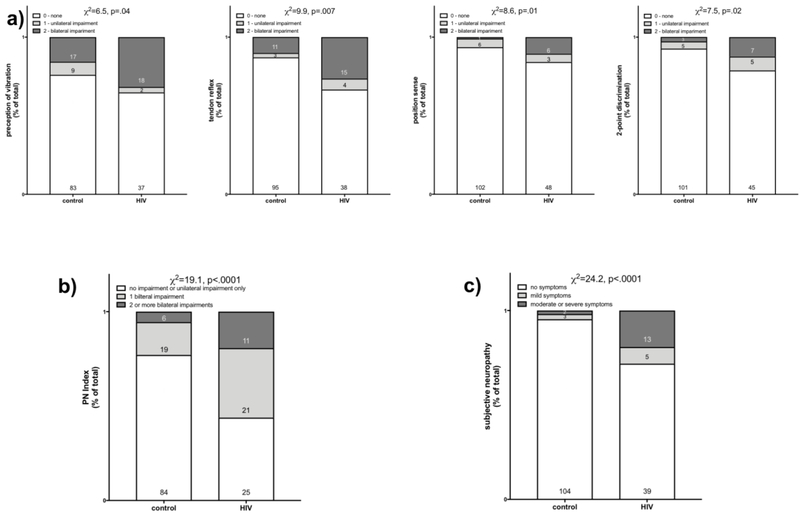
Fig 1.
a) Each graph presents percent of total group (control or HIV) with no, unilateral, or bilateral impairments on measures of perception of vibration, tendon reflex, position sense, or 2-point discrimination. b) Graph of percent of total group (control or HIV) with a PI Index of 0=no impairment or only unilateral impairment, 1= bilateral impairment on a single measure of the 4, 2=bilateral impairment on 2 or more of the 4 measures. c) Graph of percent of total group (control or HIV) with 0=no symptoms, 1=mild symptoms, 2=moderate to severe symptoms of bilateral neuropathy.

