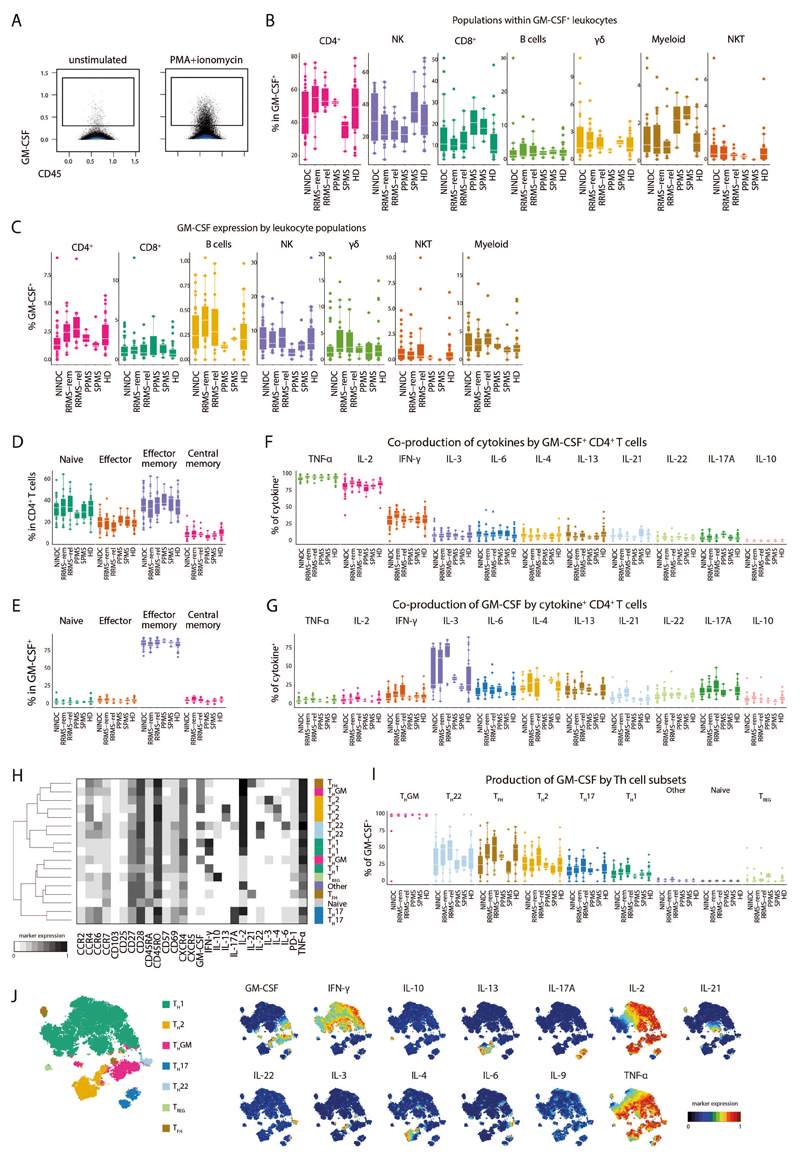
Extended Data Fig.4. Leukocyte and cytokine production characterization in MS patient subgroups.
(A) Exemplary GM-CSF production by total leukocytes with (right) or without (left) prior PMA/ionomycin stimulation (three independent experiments). (B) Frequencies of immune cell lineages within GM-CSF+ cells in NINDC (n = 21) and RRMS patients during remission (n = 17), or during relapse (n = 10), SPMS patients (n = 3), PPMS patients (n = 2) and HD (24). (C) Frequency of GM-CSF positive cells in major immune lineages in NINDC (n = 31) and RRMS patients during remission (n = 18), or during relapse (n = 12), SPMS patients (n = 5), PPMS patients (n = 3) and HD (n = 29). (D) Frequencies of FlowSOM-based Th memory subpopulations in total Th cells in NINDC (n = 31) and RRMS patients during remission (n = 18), or during relapse (n = 12), SPMS patients (n = 5), PPMS patients (n = 3) and HD (n = 29). (E) Frequencies of GM-CSF+ Th cells in patients in NINDC (n = 23) and RRMS patients during remission (n = 18), or during relapse (n = 11), SPMS patients (n = 4), PPMS patients (n = 3) and HD (n = 27). (F) Coproduction of other cytokines by GM-CSF+ Th cells in NINDC (n = 23) and RRMS patients during remission (n = 18), or during relapse (n = 11), SPMS patients (n = 4), PPMS patients (n = 3) and HD (n = 27). (G) Frequencies of GM-CSF production by cytokine+ Th cells in NINDC (n = 13) and RRMS patients during remission (n = 14), or during relapse (n = 8), SPMS patients (n = 4), PPMS patients (n = 2) and HD (n = 22). (H) FlowSOM was used to identify total Th cell subsets based on their cytokine production profile (k = 17, elbow criterion). Clusters were manually annotated based on this profile. Shown are mean expressions of surface and cytokine markers by the respective Th cell subsets. (I) Frequencies of FlowSOM defined GM-CSF+ Th cell subsets in NINDC (n = 31) and RRMS patients during remission (n = 19), or during relapse (n = 12), SPMS patients (n = 5), PPMS patients (n = 3) and HD (n = 29). (J) The tSNE algorithm (30,000 cytokine-expressing Th cells, equally selected from different clinical groups and from all samples) was used to depict different populations therein. FlowSOM-based Th subsets (left) and expression of each indicated marker (right) is overlaid. Representation plots from randomly selected cells from 3 independent experiments. Boxplots depict the IQR with a white horizontal line representing the median. Whiskers extend to the farthest data point within a maximum of 1.5x IQR. Every point represents one individual.

