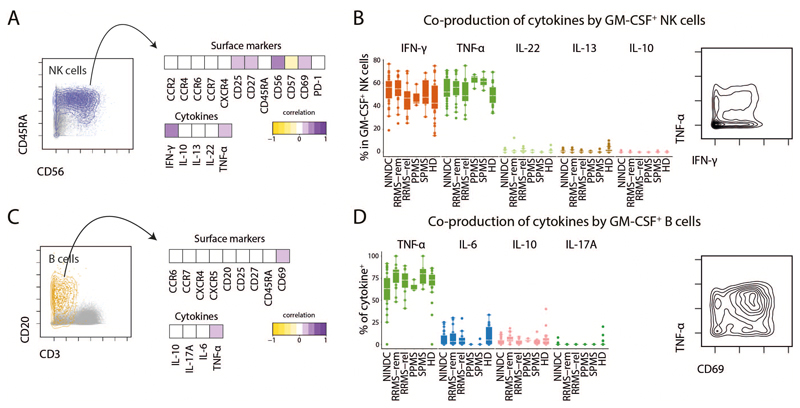
Extended Data Fig.6. Co-production profiles of GM-CSF expressing NK and B cells.
(A) Total NK cells were selected and the expression level of all relevant surface markers was correlated (Pearson’s r) with GM-CSF expression on a single-cell level. Heatmap depicts Spearman correlation coefficients. (B) Frequencies (left) and example (right) of cytokine coexpression by GM-CSF+ NK cells in NINDC (n = 31), RRMS patients during remission (n = 19), or during relapse (n = 12), SPMS patients (n = 5), PPMS patients (n = 3) and HD (n = 29). (C) B cells were selected and the expression level of all relevant surface markers was correlated (Pearson’s r) with GM-CSF expression on a single-cell level. (D) Frequencies (left) and example (right) of cytokine expression by GM-CSF+ B cells in patients as in B. Boxplots depict the IQR with a white horizontal line representing the median. Whiskers extend to the farthest data point within a maximum of 1.5x IQR. Every point represents one individual.

