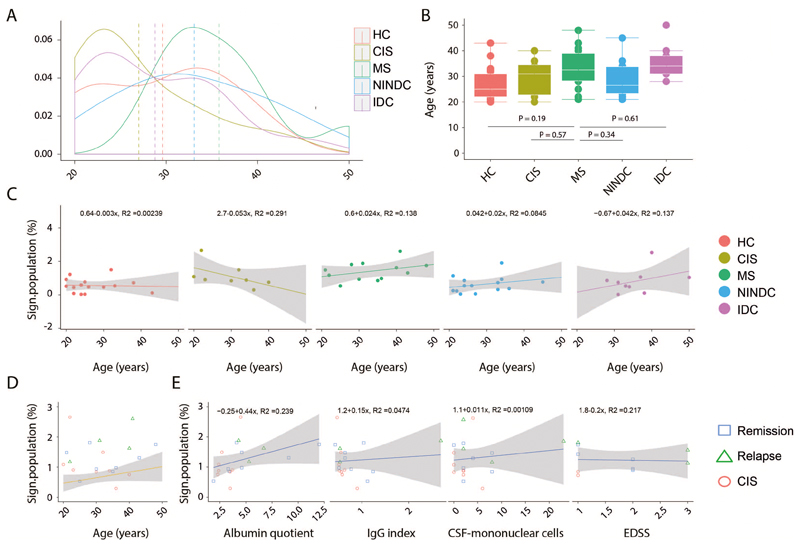
Extended Data Fig.7. Clinical correlations in the validation cohort.
(A) Age distribution among RRMS (n = 12), HC (n = 15), NINDC (n = 14), IDC (n = 9) and CIS (n =8) patients. (B) Boxplots depict the age in RRMS (n = 12), HC (n = 15), NINDC (n = 14), IDC (n = 9) and CIS (n =8) patients. (C) Correlation between frequencies of the CellCNN-defined immune signature and age in RRMS (n = 12), HC (n = 15), NINDC (n = 14), IDC (n = 9) and CIS (n =8) patients. Regression curve with confidence intervals are depicted per each group. (D) Correlation of the frequency of the signature population in T-helper cells and age among RRMS (n = 12), HC (n = 15), NINDC (n = 14), IDC (n = 9) and CIS (n =8) patients. Each symbol identifies an individual patient among CIS (n = 8), RRMS in remission (n = 8) or relapsing (n = 4) groups. The regression line with confidence intervals are based on the frequency of the signature population among the other control groups. (E) Correlation between frequencies of the CellCNN-defined immune signature and clinical parameters in RRMS in remission (n = 8) or relapsing (n = 3) and CIS (n = 8) patients. Regression curve with confidence intervals are depicted for each parameter. Boxplots depict the IQR with a white horizontal line representing the median. Whiskers extend to the farthest data point within a maximum of 1.5x IQR. P values are based on two-tailed Mann-Whitney-Wilcoxon tests between the groups. Linear correlation equation is calculated on the pool of all analysed samples. Every point represents one individual.

