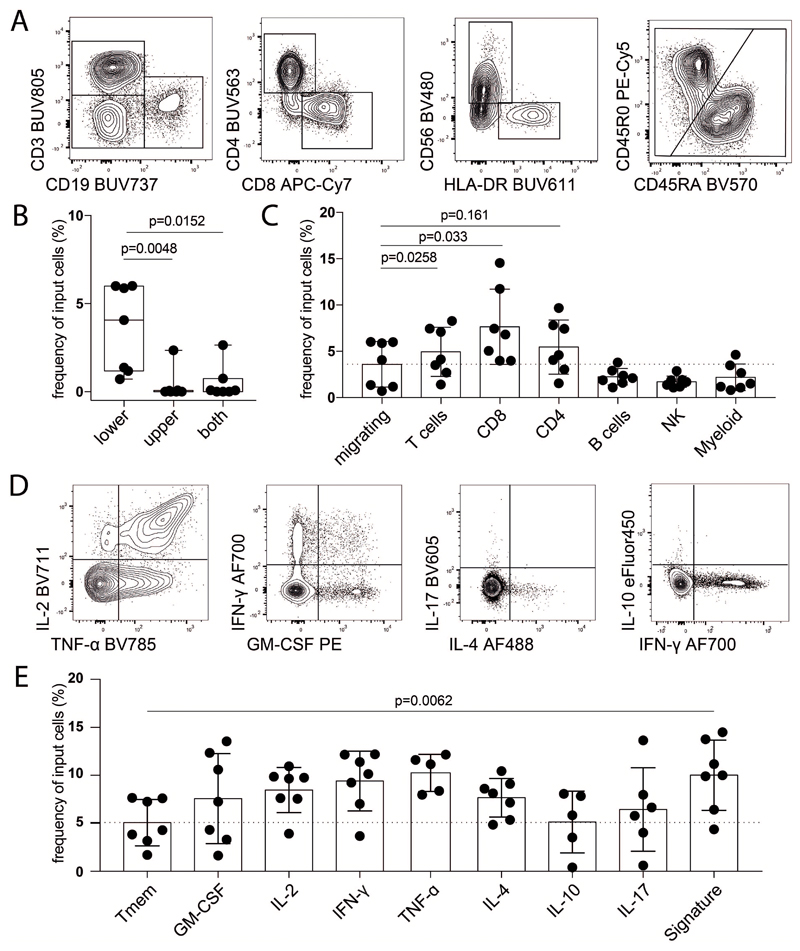
Extended Data Fig.9. SDF1α induces signature-cells migration toward a chemokine gradient.
(A) Representative plots of gating strategy of immune cells populations (n = 7). (B) Frequency of migrating cells when SDF1α was added to the lower, upper or both chambers (n = 7). (C) Frequency migrating cells in the lower chamber toward an SDF1α gradient calculated as frequency of population specific input cells (n = 7). Representative plots (D) and quantification (E) of different cytokine-producing T-helper cells calculated as frequency of input cells (n = 7). Representative plots of 2 independent experiments. P values are based on two-tailed Mann-Whitney-Wilcoxon tests between the groups. Boxplots depict the IQR with a horizontal line representing the median. Columns plot represent the mean. Whiskers extend to the farthest data point within a maximum of 1.5x IQR. Every point represents one individual.

