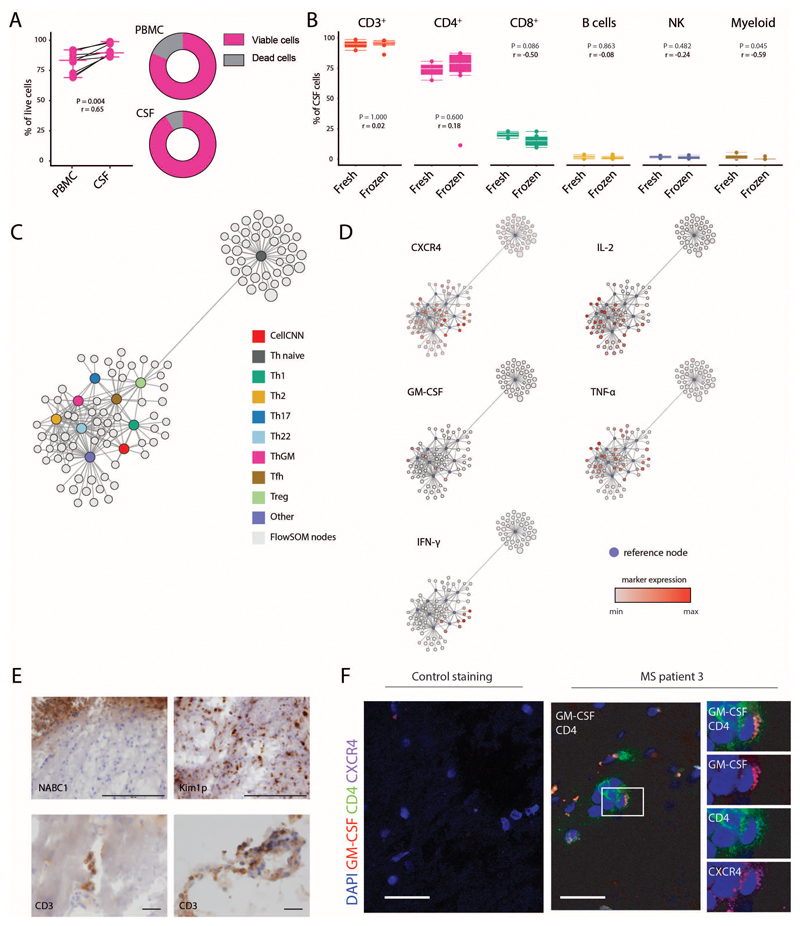
Extended Data Fig.10. CNS immune features of MS patients.
Quantification (A) of cell viability in paired PBMC- CSF-samples (n = 9). (B) Frequencies of immune cell lineages in CSF between fresh (n = 3) and cryopreserved (n = 9) CSF samples. (C) Scaffold reference map of the Th cell compartment was constructed from mass cytometry data. Grey bubbles represent the 100 FlowSOM nodes and colored landmarks are based on FlowSOM defined Th cell subsets. (D) Expression of CellCNN signature-defining cytokines and chemokine receptors within mapped FlowSOM nodes. (E) Immunohistochemistry of MS brain lesions depicting a demyelinated lesion (top left; myelin IHC) with KiM1P positive macrophages/activated microglial cells (top right, scale bar 200µm); CD3 positive perivenular T cell infiltration within the demyelinated lesion (bottom left) as well as in the meninges (bottom right, scale bar 30 µm). (F) Immunofluorescence control for secondary antibodies staining (left) and MS-brain lesion (right). Experiment repeated from brain biopsies of 3 individual MS patients as for Figure 6J. Scale bars = 30 µm. P values are based on two-tailed Mann-Whitney-Wilcoxon tests between the groups. Correlation coefficients (r) were calculated from the z-statistic of the Wilcoxon-Mann-Whitney test. Boxplots depict the IQR with a white horizontal line representing the median. Whiskers extend to the farthest data point within a maximum of 1.5x IQR. Every point represents one individual.

