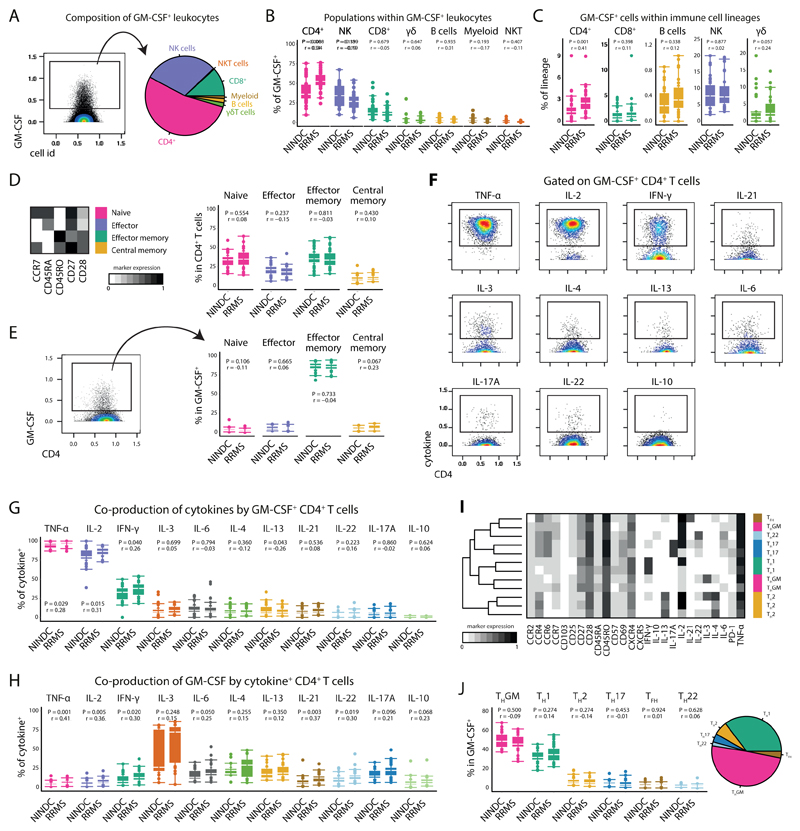
Fig 2. GM-CSF competent T-helper cells are increased in MS.
(A) Single, live, CD45+ cells positive for GM-CSF expression were selected (left) and their composition across RRMS (n = 31) and NINDC (n = 31) patient samples based on previously defined lineages is shown (right). (B) Frequencies of immune cell lineages within GM-CSF+ cells as in B stratified to compare RRMS (n = 31) vs. NINDC patients (n = 29). (C) Frequency of GM-CSF positive cells in major immune lineages in patients. .Th cells from RRMS (n = 31) and NINDC patients (n = 31) were subdivided into naïve, effector, effector memory and central memory cells based on FlowSOM-defined nodes. (D) Mean population expression levels of the indicated differentiation markers (left). Frequencies of Th subsets in RRMS (n = 31) and NINDC patients (n = 31). (E) Frequencies of GM-CSF+ Th cells in patients as in D in RRMS (n = 30) and NINDC patients (n = 29). (F) Coproduction of other cytokines by GM-CSF+ Th cells. (G) Frequencies of cytokine coproduction by GM-CSF+ Th cells in RRMS (n = 30) and NINDC patients (n = 29). (H) Frequencies of GM-CSF production by cytokine+ Th cells in RRMS (n = 20) and NINDC patients (n = 13). (I) FlowSOM was used to identify GM-CSF+ Th cell subsets based on their cytokine production profile (k = 12, elbow criterion). Clusters were manually annotated based on this profile. Shown are mean expression of surface and cytokine markers by the respective Th cell subsets. (J) Frequencies (left) and relative fractions (right) of FlowSOM defined GM-CSF+ Th cell subsets. Data from three independent experiments are shown. P values are based on two-tailed Mann-Whitney-Wilcoxon tests between the groups. Correlation coefficients (r) were calculated from the z-statistic of the Wilcoxon-Mann-Whitney test. Boxplots depict the IQR with a white horizontal line representing the median. Whiskers extend to the farthest data point within a maximum of 1.5x IQR. Every point represents one individual.

