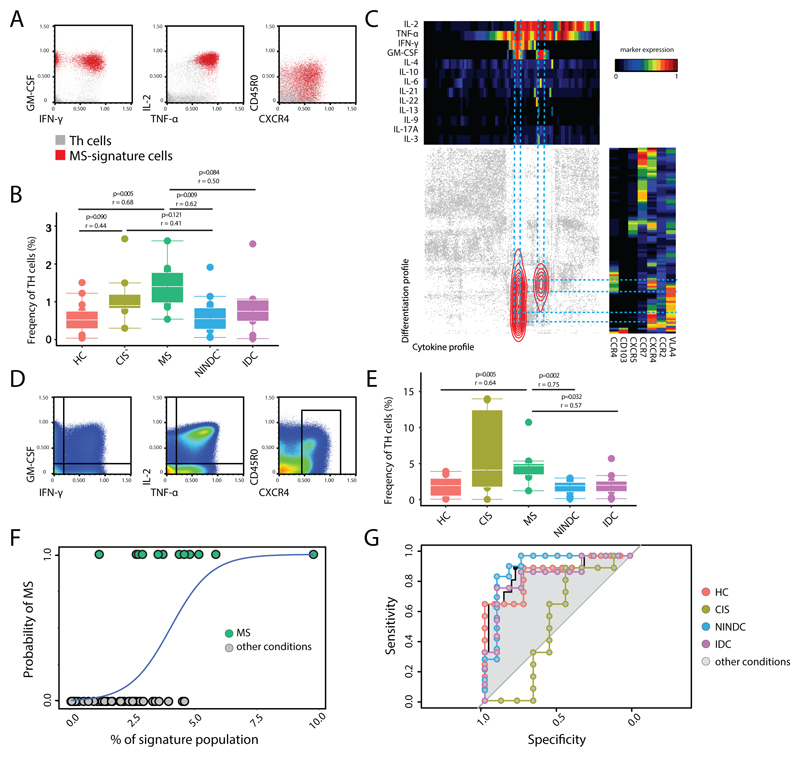
Fig 4. Signature T-helper population is enriched in MS.
An independent validation cohort of total PBMCs from RRMS (n = 12), HC (n = 15), NINDC (n = 14), IDC (n = 9) and CIS (n =8) patients was analyzed by mass cytometry. Representative plots (A) and quantification (B) of CellCNN filters applied to the new cohort. (C) Selected Th cells were used as input for two independent, categorical (cytokines, trafficking) tSNE dimensionality reductions and then plotted against each other. Density distribution of CellCNN-selected cells is overlaid in color. Heat maps depict mean expression levels in each bin. Representative plots of all cells analyzed (D) and quantification (E) of manually-gated GM-CSF, IFN-γ, IL-2, TNF, CXCR4 expressing Th signature. (F) Logistic regression curve of the frequency of the manually-gated population (predictor) in MS and the other clinical conditions. (G) ROC curves representing MS predictivity of the signature population in different settings. P values are based on two-tailed Mann-Whitney-Wilcoxon tests between the groups. Correlation coefficients (r) were calculated from the z-statistic of the Wilcoxon-Mann-Whitney test. Boxplots depict the IQR with a white horizontal line representing the median. Whiskers extend to the farthest data point within a maximum of 1.5x IQR. Every point represents one individual.

