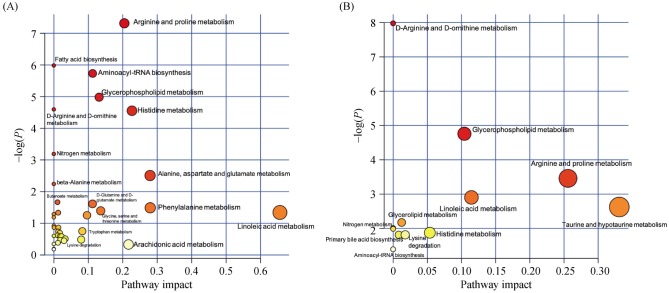
Figure 2. Metabolic pathways as deduced from differential metabolites of peripheral venous blood between HF patients and healthy subjects (A), as well as between CRT responders and non-responders (B).
All matched pathways are plotted according to P values from pathway enrichment analysis and pathway impact values from pathway topology analysis. Color gradient and circle size indicate the significance of the pathway ranked by p value (yellow: higher P values and red: lower P values) and pathway impact values (the larger the circle the higher the impact score). Only the significantly affected pathways with low P value and high pathway impact score are shown. CRT: cardiac resynchronization therapy; HF: heart failure.

