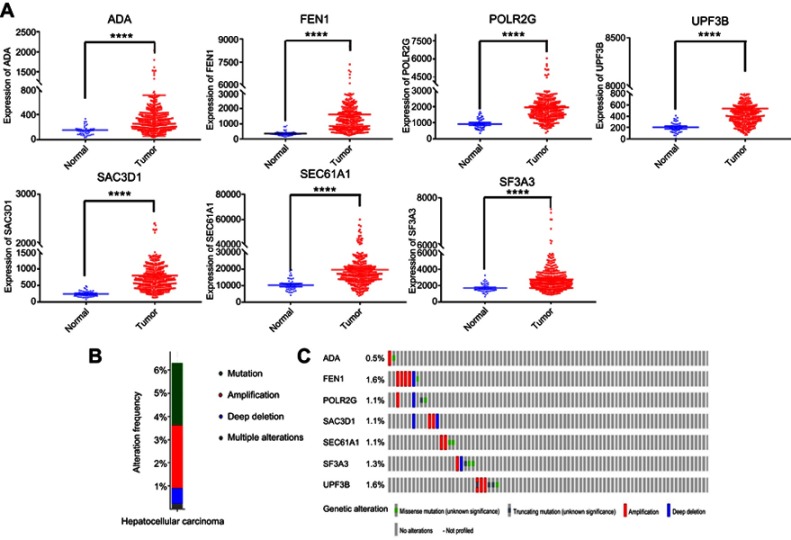
Figure 2.
Seven screened mRNA which associated with OS.
Notes: (A) Different expression of seven mRNAs in tumor and adjacent non-tumor tissues, ****represents for p-value <0.0001). (B) The total genetic alteration of 7 genes in the HCC sample. (C) Genetic alterations in each of the seven genes in the prognosis signature. Red and blue represent amplification and deletion, respectively.

