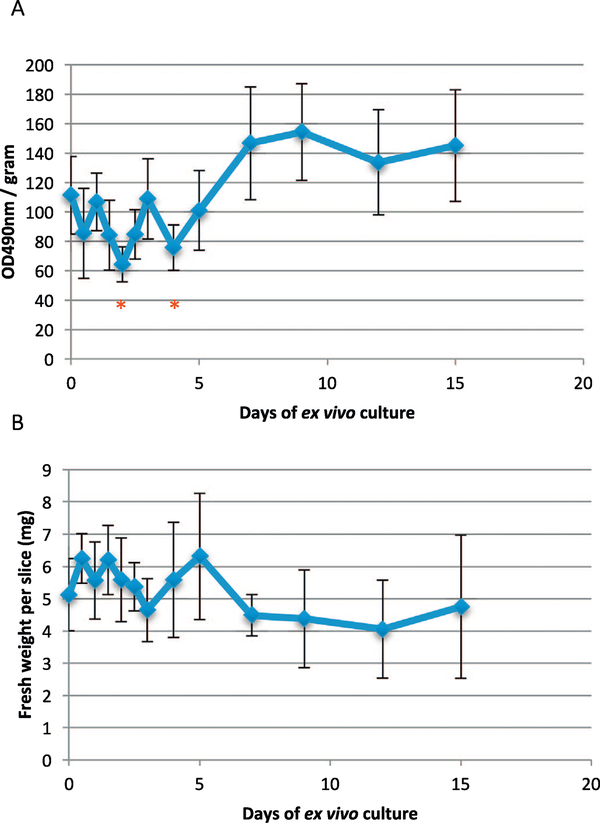
Fig. 1.
Metabolic activity of human liver slices after ex vivo culturing for a 15-day period. (A) MTS activity of liver slices normalized by the fresh cell weight of the liver slices. (B) Measurements of fresh weight of liver slices. Error bars indicate the 95% confidence interval of standard deviation of seven replicates at each time point. Asterisks indicate the statistically significant differences compared with time zero using the two-way ANOVA test (*, P < 0.05).

