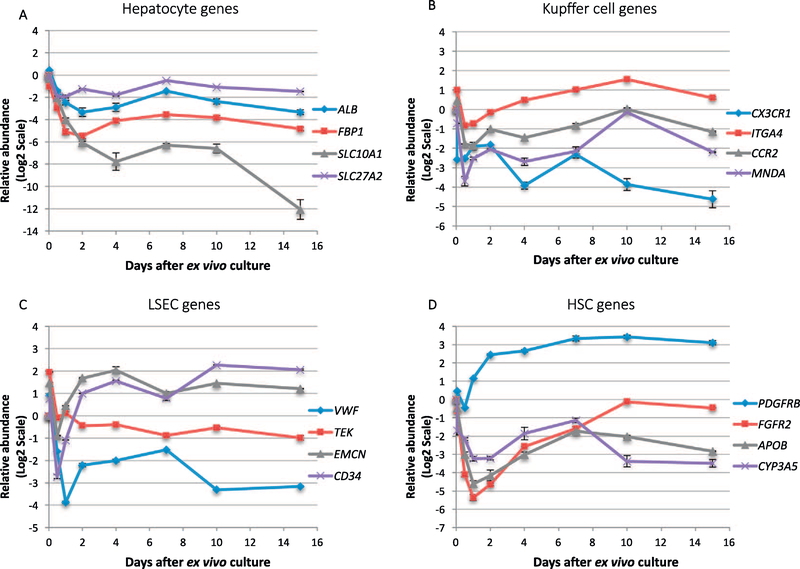
Fig. 2.
Expression of liver cell-type-specific genes in the ex vivo culture. Genes are classified as (A) Hepatocyte, (B) Kupffer cell, (C) LSEC, (D) HSC. Data are expression based on qRT-PCR and relative to time zero. Error bars indicates the standard deviation of three liver slices cultured from the same patients at each time point. Similar trend of expression changes was also observed in the other two analyzed patients.

