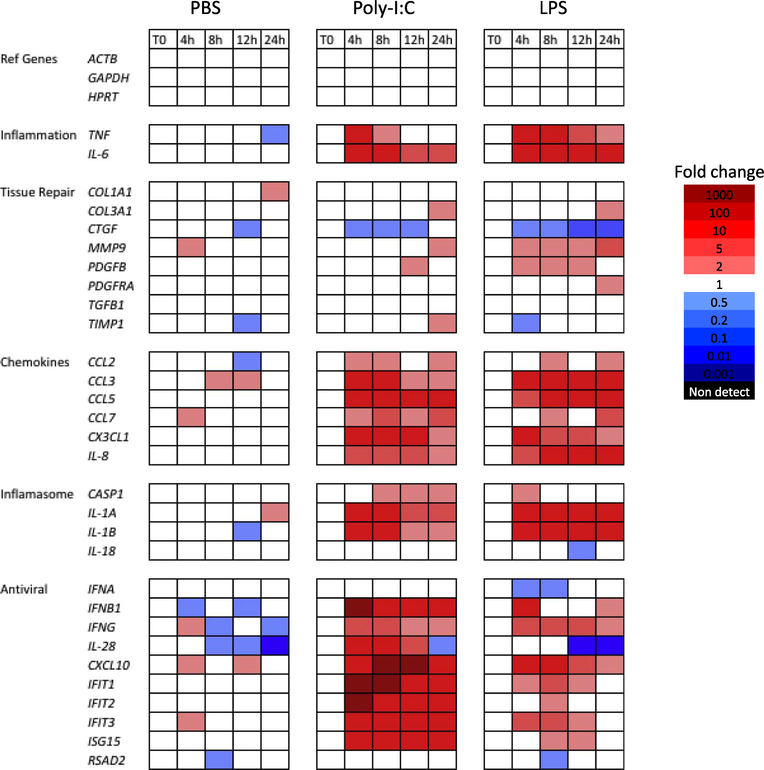
Fig. 5.
Innate immune response of liver slices to Poly-I:C and LPS stimuli. Fold changes are referenced to the day 7 time zero slices. Red color indicates increased abundance, and blue color indicates decreased abundance. The PBS treatment is included as the control. Solid blocks of red indicate increased expression of chemokine genes and anti-viral genes, starting at 4 h after treatment. (For interpretation of the references to color in this figure legend, the reader is referred to the web version of this article.)

