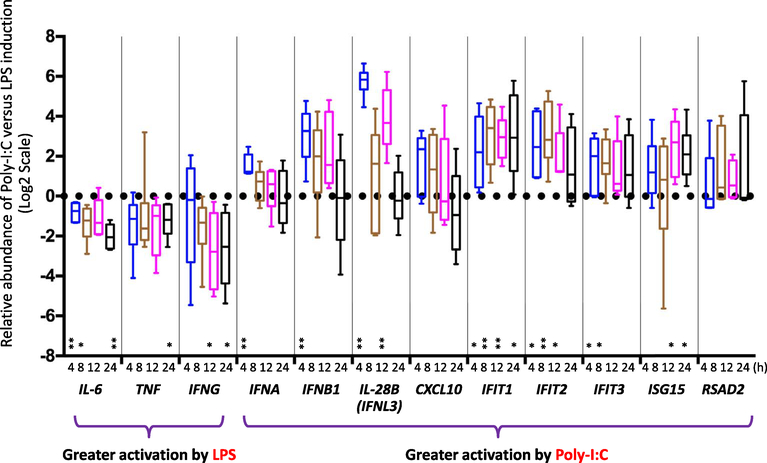
Fig. 6.
Antiviral response preferentially induced by Poly-I:C compared with LPS. Box-and-whisker plot shows the inter-quartile range, the median value, and the 95% confidence interval of the standard deviation of data representing six patient samples. Responses were examined at four time points, including 4 h, 8 h, 12 h, 24 h. Fold changes are referenced to the time zero for each patient. A positive value indicates a more marked increase induced by Poly-I:C compared with LPS; conversely a negative value indicates a more marked increase induced by LPS compared with Poly-I:C. Statistical significance is indicated (*, < 0.05; **, < 0.01; two-way ANOVA test).

