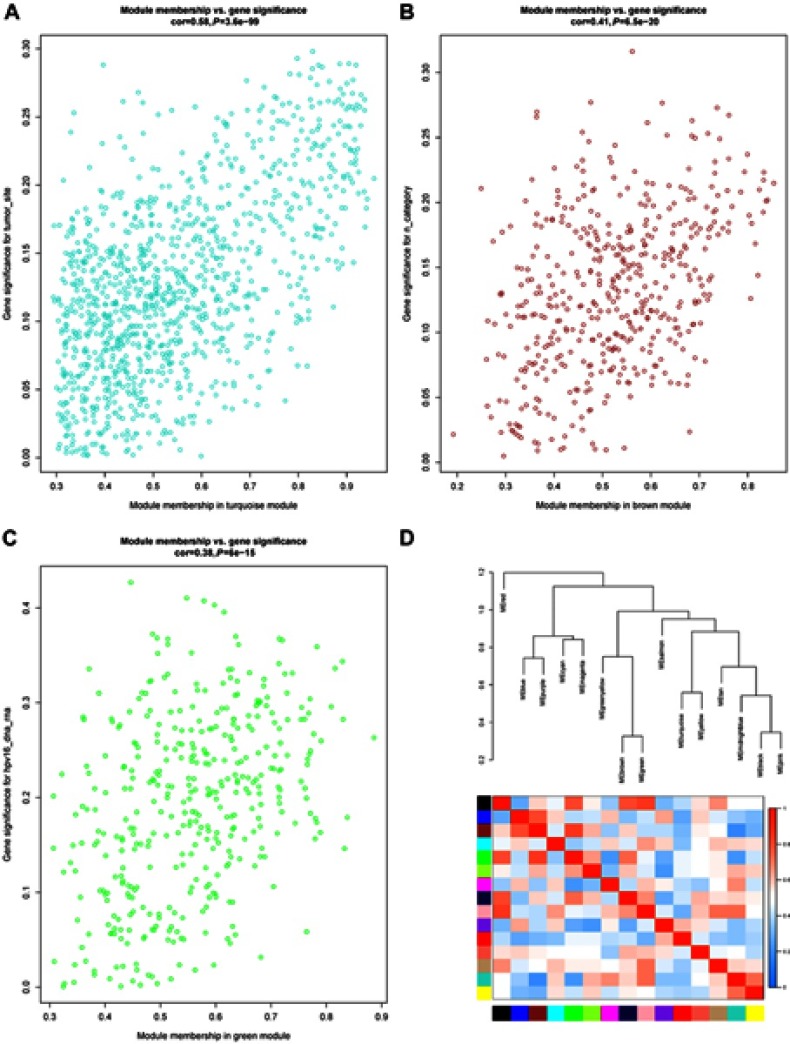
Figure 5.
(A) Scatter plot of gene significance for the tumor site and module membership in the turquoise module. (B) Scatter plot of gene significance for the n category and module membership in the brown module. (C) Scatter plot of gene significance for HPV16 infection and module membership in the green module. (D) Eigengene dendrogram and eigengene adjacency heatmap.

