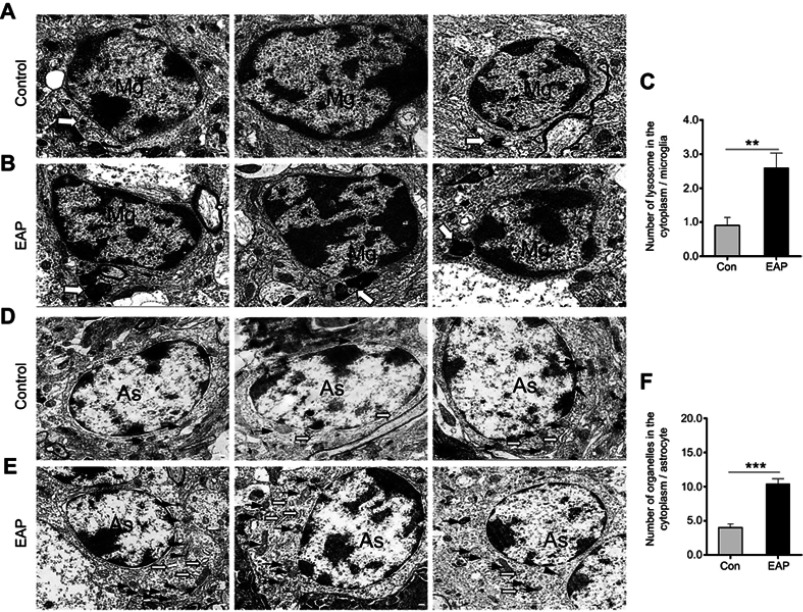
Figure 4.
Ultrastructural changes in hippocampal glial cells. (A) TEM observation shows a normal appearance of microglial cells with a primary lysosome (hollow arrow) in the control group. (B) Microglia activation in the EAP group was evidenced by increased and enlarged lysosomes (hollow arrow) in the cytoplasm. (C) Quantitative analysis of the number of lysosomes in the cytoplasm of microglia. (D) The control group showed normal astrocyte morphology with a few mitochondria (arrows) in the cytoplasm. (E) Reactive astrocytosis characterized by increased cytoplasmic Golgi body (arrowheads), endoplasmic reticulum (hollow arrows), and mitochondria (arrows) in the EAP group. (F) Quantitative analysis of the number of organelles in the cytoplasm of microglia. Scale bar is 200 nm. **p<0.01, and ***p<0.001, vs Control.
Abbreviations: TEM, transmission electron microscopy; EAP, experimental autoimmune prostatitis; Mg, microglia; As, astroglia.

