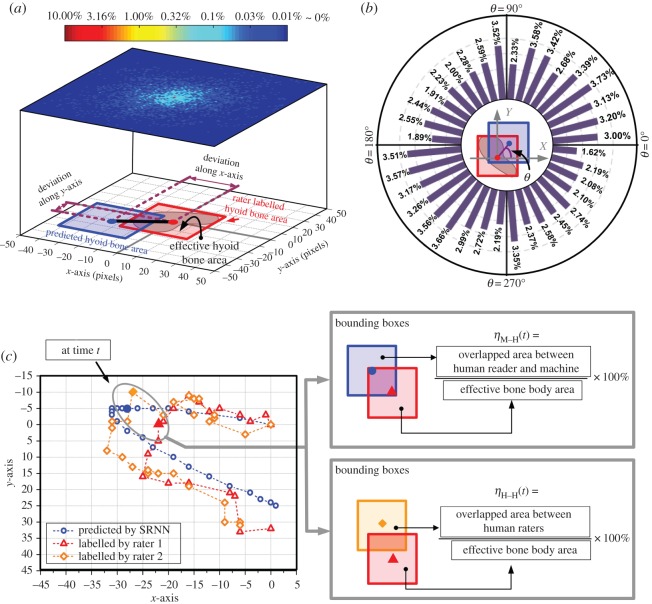
Figure 4.
Hyoid bone movement tracking results of the in silico test. The blue and red bounding boxes denote the predicted and human rater labels of hyoid bone location, respectively. The distribution of the deviation is shown in (a), and the colour bar shows the proportions corresponding to different pixel coordinates. The angular deviation is also summarized in (b), which is presented in the histogram according to the variation of θ. In (a,b), we set the centre point of red boxes (human labelled hyoid bone) at the origin of coordinates for clear comparison. An exemplary result of hyoid bone tracking is shown in (c) with the comparison of two human raters’ annotated results.

