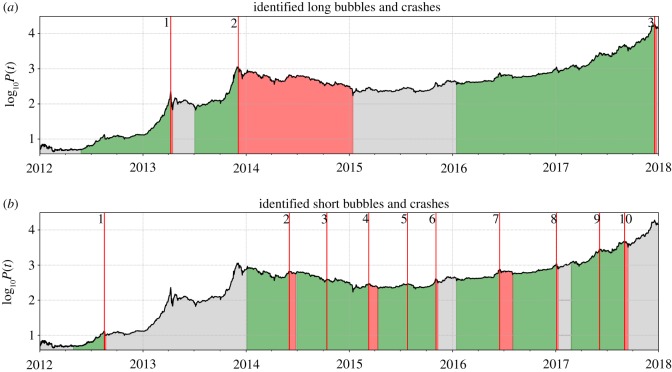
Figure 2.
Bitcoin Bubbles from January 2012 to February 2018. The three resulting identified long (a) and 10 short (b) bubbles, before filtering for short bubble characteristics. The green bands delineate the bubble growth phases, while the red shaded regions represent the associated crashes or correction regimes. The grey areas indicate phases of ‘non-bubble price growth’, as defined in the text. The numbers to the left of the vertical red lines map to those given in figure 1. We can see that Short Bubbles 3 and 4 do not qualify as real bubbles, as their return over the green growth phase is negative (table 1). As stated in the text, they were therefore removed from the analysis.

