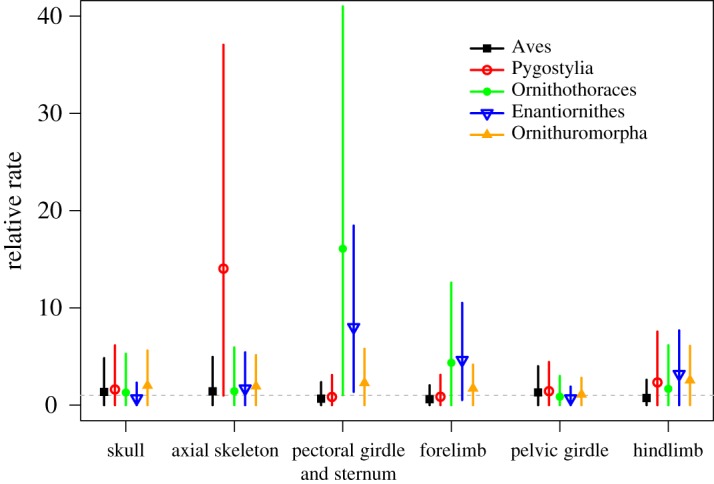
Figure 2.

Posterior estimates of the relative clock rates along the branches subtending the major transitions of early avian evolution for six anatomical regions of the bird body. The dot and error bar denote the mean and 95% HPD interval for each estimate, respectively. The horizontal dashed line indicates the mean relative rate of 1.0 in the relaxed model.
