
Figure 2.
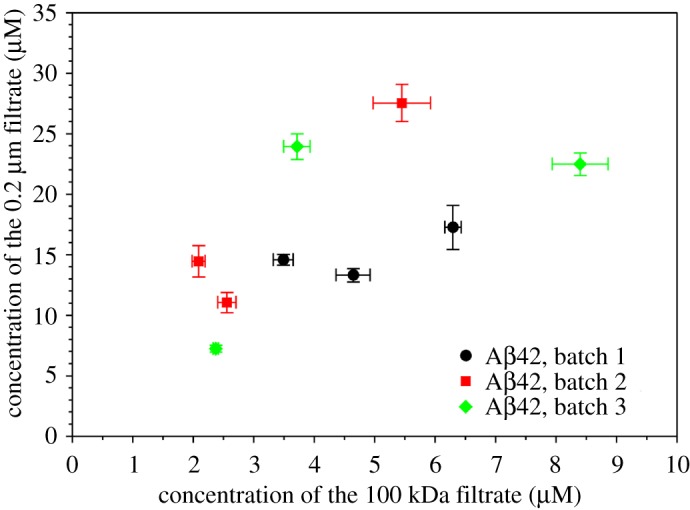
Batch variations of Aβ42 oligomer size distributions. Aβ42 samples of three batches, three samples from each batch, were filtered through 100 kDa and 0.2 µm filters, and concentrations were measured. Error bars are the standard deviations of three independent concentration measurements.