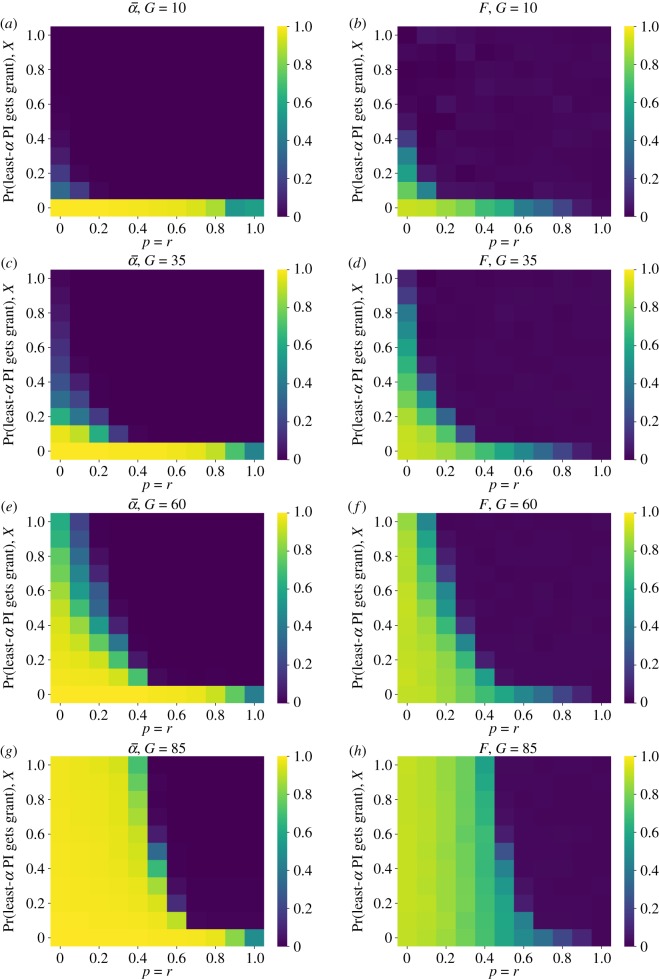
Figure 6.
Average false positive rate () and false discovery rates (F) under mixed strategy (MS) funding allocation for varying rates of funding rigour (X), open science improvements (p = r) and funding level (G). (a) False positive rate, G = 10; (b) false discovery rate, G = 10; (c) false positive rate, G = 35; (d) false discovery rate, G = 35; (e) false positive rate, G = 60; (f) false discovery rate, G = 60; (g) false positive rate, G = 85 and (h) false discovery rate, G = 85.

