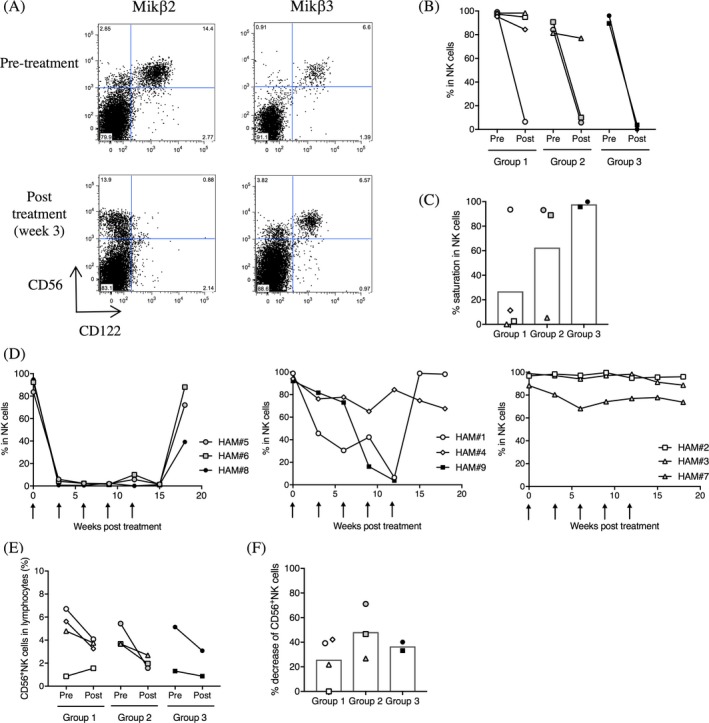
Figure 1.

Saturation of CD122 on NK cells. (A) Representative dot plots of CD122 (Mikβ2 and Mikβ3) and CD56 expressions in CD3‐ lymphocytes of a HAM/TSP patient. (B) Frequencies of Mikβ2+ CD56+ NK cells in HAM/TSP patients at pretreatment (pre) and at week 12 of Hu‐Mikβ1 treatment (post). (C) Saturation of Mikβ2+ CD56+ NK cells in HAM/TSP patients (group 1, 2, and 3) at week 12 of Hu‐Mikβ1 treatment. Each bar graph represents the mean. (D) Change of frequencies of Mikβ2+ CD56+ NK cells in HAM/TSP patients (HAM#5, #6 and #8; left graph, HAM#1, #4, and #9; center graph, HAM#2, #3, and #7; right graph) during Hu‐MiKβ1 trial. Arrows indicate Hu‐Mikβ1 dosing. (E) Frequencies of CD56+ NK cells in HAM/TSP patients at pretreatment (pre) and at week 12 of Hu‐Mikβ1 treatment (post). (F) Decrease of CD56+ NK cells in HAM/TSP patients (group 1, 2, and 3) at week 12 of Hu‐Mikβ1 treatment. Each bar graph represents the mean
