Figure 3.

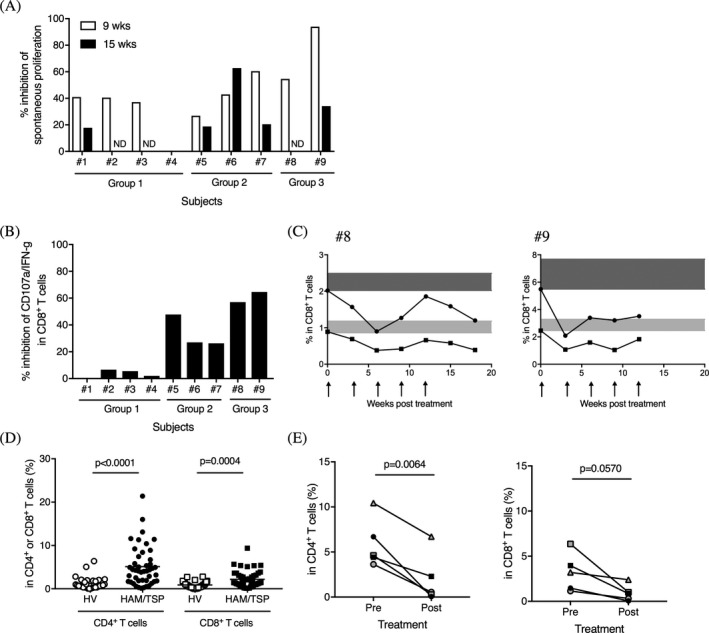
Inhibitory effects of Hu‐Mikβ1 on T cell function in HAM/TSP patients. (A) Inhibition of spontaneous lymphoproliferation in HAM/TSP patients at week 9 and week 15 of Hu‐Mikβ1 treatment. ND; not done. (B) Inhibition of CD107a and IFN‐γ expression in CD8+ T cells of HAM/TSP patients at week 9 of Hu‐Mikβ1 treatment. (C) Inhibitory effects of Hu‐Mikβ1 on CD107a and IFN‐γ expression in CD8+ T cells of HAM/TSP patients (#8 and #9) during Hu‐Mikβ1 trial. Arrows indicate Hu‐Mikβ1 dosing. The baselines of CD107a expression (closed circles) and both CD107a and IFN‐γ expression (closed squires) in PBMC CD8+ T cells of each HAM/TSP patients are highlighted in dark gray and light gray, respectively (D) Comparisons of pSTAT5 in CD4+ and CD8+ T cells of HVs and HAM/TSP patients. The horizontal line represents the mean. (E) Frequencies of pSTAT5 in CD4+ T cells (left) and in CD8+ T cells (right) of HAM/TSP patients (#5‐#9) at pretreatment (pre) and at week 9 of Hu‐Mikβ1 treatment (post)
