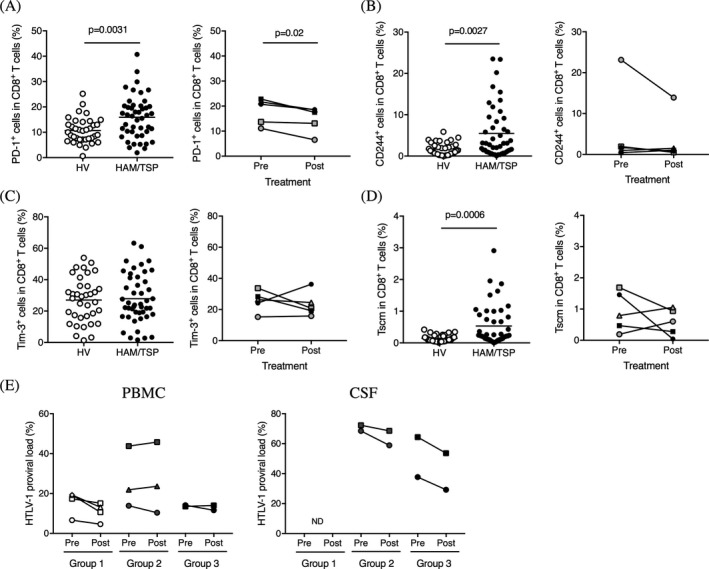
Figure 4.

Alternative changes in HAM/TSP patients. (A) Comparison of frequency of PD‐1+ cells in CD8+ T cells of HVs and HAM/TSP patients (left graph). The horizontal line represents the mean. Comparison of frequency of PD‐1+ cells in CD8+ T cells of HAM/TSP patients at pretreatment (pre) and at week 9 of Hu‐Mikβ1 treatment (post) (right graph). (B) Comparison of frequency of CD244+ cells in CD8+ T cells of HVs and HAM/TSP patients (left graph). The horizontal line represents the mean. Comparison of frequency of CD244+ cells in CD8+ T cells of HAM/TSP patients at pretreatment (pre) and at week 9 of Hu‐Mikβ1 treatment (post) (right graph). (C) Comparison of frequency of Tim‐3+ cells in CD8+ T cells of HVs and HAM/TSP patients (left graph). The horizontal line represents the mean. Comparison of frequency of Tim‐3+ cells in CD8+ T cells of HAM/TSP patients at pretreatment (pre) and at week 9 of Hu‐Mikβ1 treatment (post) (right graph). (D) Comparison of frequency of Tscm cells in CD8+ T cells of HVs and HAM/TSP patients (left graph). The horizontal line represents the mean. Comparison of frequency of Tscm cells in CD8+ T cells of HAM/TSP patients at pretreatment (pre) and at week 12 of Hu‐Mikβ1 treatment (post) (right graph). (E) Comparison of HTLV‐1 proviral load in PBMC (left graph) and CSF (right graph) of HAM/TSP patients at pretreatment (pre) and at week 12 of Hu‐Mikβ1 treatment (post)
