
Figure 1.
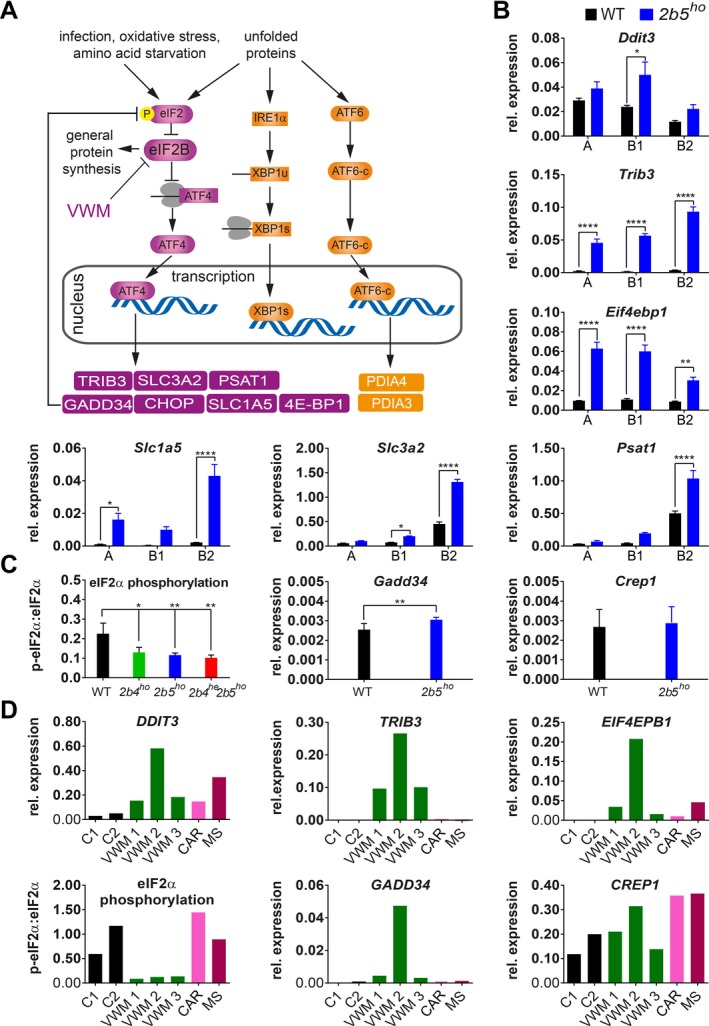
Polysomal profiling of 2b5ho mouse brain identifies ISR deregulation in mouse VWM and human VWM brain. (A) Summary of ISR‐ and UPR‐regulated transcription included to clarify the link between the ATF4, ATF6‐c, and XBP1s transcription factors and mRNA targets investigated in this study. (B) ATF4‐regulated mRNA levels in gradient fractions from forebrain lysates from 4‐month‐old WT and 2b5ho mice were measured to visualize the mRNA distribution in monosome fraction (A), polysome fractions (B1, less than 5 ribosomes per mRNA; B2, 5 or more ribosomes per mRNA). Graphs show average ± SD, n = 3 (Akt, qPCR reference). Statistical significance was determined by two‐way ANOVA with Sidak’s correction; *P < 0.05, **P < 0.01, ****P < 0.0001). Raw data for reference mRNAs are shown in Data S7. (C) eIF2α phosphorylation, Gadd34 and Crep1 mRNA expression levels were measured in cerebellar tissue from WT and VWM mice, as indicated. Graphs show average ± SD, n = 3 for eIF2α phosphorylation and n = 6 for mRNA expression (Gapdh + Akt, qPCR reference). Statistical differences in eIF2α phosphorylation were determined using a one‐way ANOVA followed by a Dunnet’s correction. Differences between WT and 2b5ho qPCR data were assessed with Student’s t‐test, *P < 0.05, **P < 0.01. (D) DDIT3, TRIB3, EIF4EBP1 mRNA levels, eIF2α phosphorylation, GADD34 and CREP1 mRNA levels were quantified in postmortem frontal white matter tissue from VWM patients and controls (negative controls without brain pathology, C1, C2, and disease controls CAR and MS; CAR, CARASAL; MS, multiple sclerosis). Expression differences among VWM patients inversely correlate with postmortem delay time (AKT + GAPDH, qPCR reference, n = 1). Details on control and patients’ tissue are listed in Data S5. Statistical test outcomes are in Data S6.