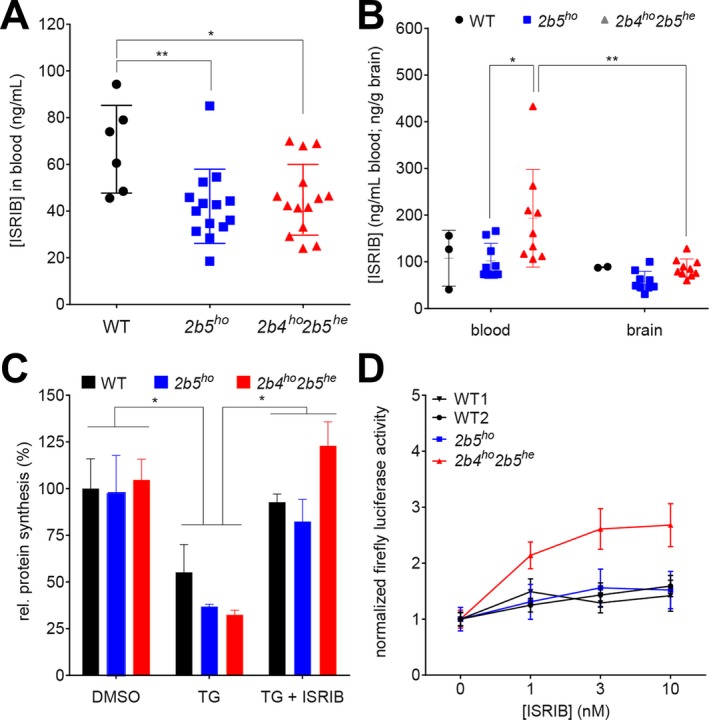
Figure 7.

ISRIB’s efficacy in VWM is influenced by the identity of eIF2B mutation. (A) ISRIB concentrations were determined in venous blood samples obtained from WT (n = 6 per group) and VWM mice (2b5ho and 2b4ho2b5he n = 14 per group) after 14 days of daily ISRIB injections (24 h after the latest injection); data obtained from placebo‐treated animals were below detection and were omitted from the graph. Statistical differences among genotypes were determined with one‐way ANOVA followed by Tukey’s correction. (B) ISRIB concentrations were determined in postmortem blood and olfactory bulb tissue from WT (n = 2 per group) and VWM mice (2b5ho and 2b4ho2b5he n = 9 and n = 8 per group). Statistical differences were determined with Two‐way ANOVA (tissue and genotype as factors) with Tukey’s correction. (C) ISRIB restored protein synthesis rates in primary cultures of adult mouse astrocytes undergoing UPR, most effectively in cells from 2b4ho2b5he mice. TG effects were not statistically significant as before29. Statistical differences in test conditions (DMSO vs. TG vs. TG + ISRIB within WT, 2b5ho, and 2b4ho2b5he adult mouse astrocytes were determined with two‐way ANOVA with Tukey’s correction (n = 2). (D) ISRIB enhanced expression of Gapdh‐driven firefly luciferase reporter in 2b4ho2b5he astrocytes at lower concentrations than in WT or 2b5ho astrocytes (P = 0.0026). WT1 and WT2 indicate different isolation dates. Cells were exposed to 300 nmol/L thapsigargin for 16 h with increasing concentrations of ISRIB. Areas under curve (AUC) were calculated for each cell isolate per transfection experiment after correcting for differences between experiments but not between test conditions within experiments (genotype, treatments). Statistical differences between ISRIB sensitivity in WT1, WT2, 2b5ho, and 2b4ho2b5he adult mouse astrocytes were determined with one‐way ANOVA with Sidak’s correction using AUC values. For all panels, *P < 0.05, **P < 0.01. Statistical test outcomes are in Data S6. Graphs show mean ± SD (A–C) or mean ± SEM (D).
