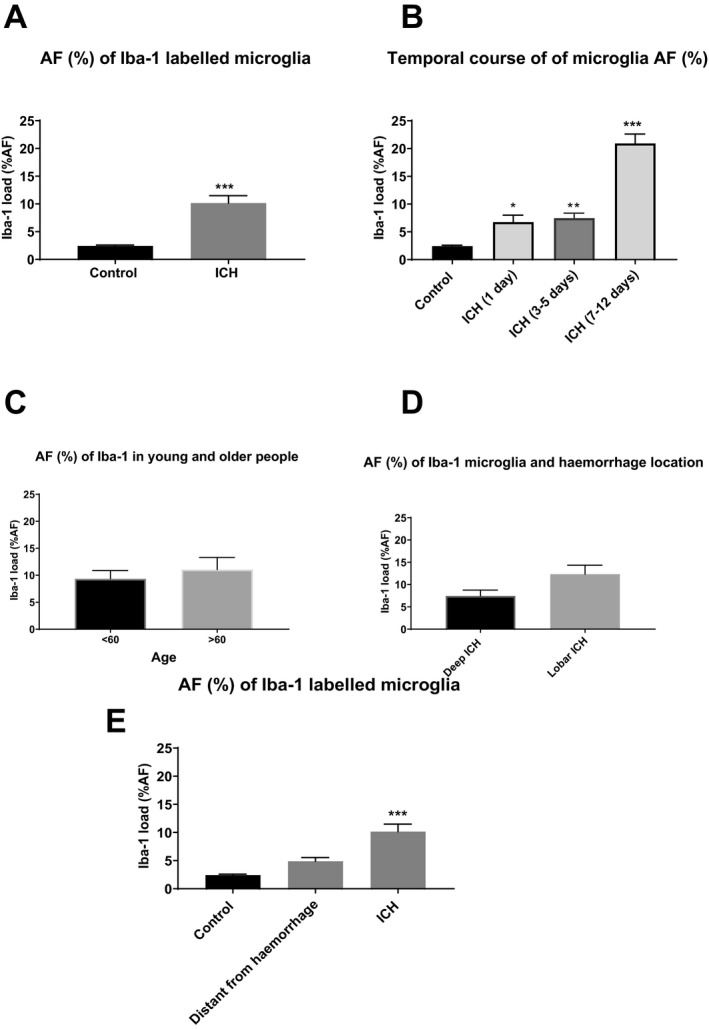
Figure 4.

Iba1 microglia in control and ICH subjects. (A) Iba1 %AF (%) microglia increased significantly in 27 ICH subjects when compared to 18 controls (P < 0.0001). (B) Iba1 % increased significantly in subjects who died 1 day after ICH and 3–5 days after ICH. The greatest change was observed in subjects dying 5–12 days post‐ICH. (C) Iba1 microglial expression did not change when comparing those above 60 years old (n = 14) with those below 60 years old (n = 13; P = 0.54). (D) A trends toward increase was detected for Iba1 load in lobar ICH (n = 15, 12.3%) when compared to deep ICH (n = 12, 7.5%; P = 0.06). *P < 0.05, **P < 0.01, ***P < 0.00. (E) Iba1 microglia in control and ICH subjects (peri‐hemorrhage and distant from hemorrhage). Iba1 %AF (%) microglia increased significantly in 27 ICH subjects when compared to 18 controls (P < 0.0001). There was no significant difference in Iba1 load when comparing distant from hemorrhage (a lobe from hemorrhage or equivalent contralateral anatomical area) quantification to control (n = 13, 4.9% vs. 2.4% in controls, P = 0.52). There was a significant increase in Iba1 %AF in ICH when compared to distant from hemorrhage (10.16% vs. 4.9% P = 0.007). One‐way ANOVA with Bonferroni’s posthoc test. *P < 0.05, **P < 0.01, ***P < 0.001. ICH, intracerebral hemorrhage.
