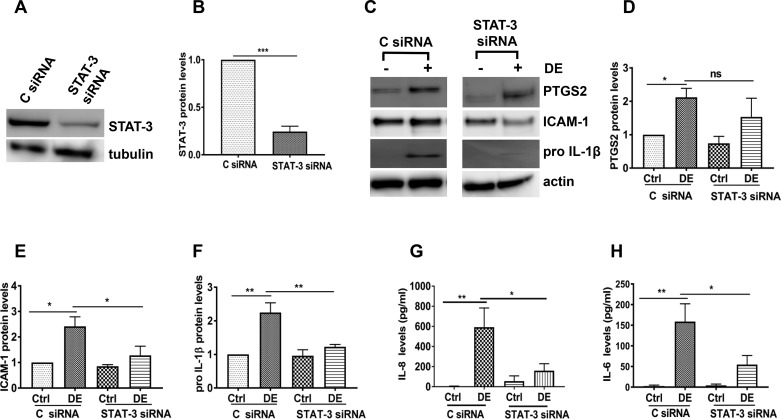
Fig. 4.
Effects of STAT-3 knockdown on the induction of inflammatory mediators in Beas2B cells. Control siRNA (C siRNA) and STAT-3 siRNA were transfected into cells, and 72 h later, cells were treated with medium [control (Ctrl)] or 0.25% dust extract (DE) for 3 h. A and B: STAT-3 levels were determined by Western blot analysis and normalized to tubulin or actin levels. STAT-3 levels in C siRNA-transfected control cells were arbitrarily considered as 1, and relative levels in STAT-3 siRNA-transfected cells are shown. Data shown are means ± SE (n = 4). ***P < 0.001 according to two-tailed paired t-test. C–F: prostaglandin G/H synthase 2 (PTGS2), ICAM-1, and pro-IL-1β levels were determined by Western blot analysis and normalized to actin. Levels in control siRNA-transfected control cells were arbitrarily considered as 1, and relative levels in other treatments are shown. Data shown are means ± SE (n = 4); ns, not significant, *P < 0.05, **P < 0.01 according to one-way analysis of variance with Tukey’s multiple-comparison test. G and H: IL-8 and IL-6 protein levels in cell medium were determined by ELISA. Data shown are means ± SE (n = 4 for IL-8 and n = 5 for IL-6). *P < 0.05, **P < 0.01 according to one-way analysis of variance using Tukey’s multiple-comparison test.

