Fig. 3.
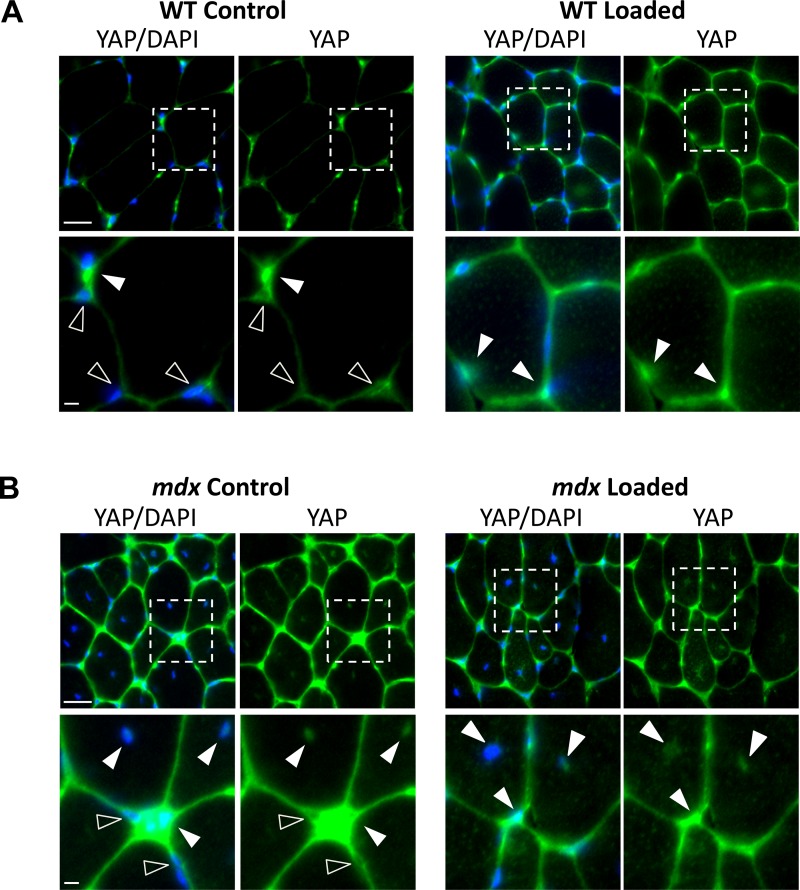
YAP distribution in muscles in response to repeated maximal contractions in vivo. Representative cross sections showing YAP labeling (green) and nuclei (blue, DAPI). Bottom panels show magnification of area indicated by dotted white box in corresponding top panel. A: YAP labeling was increased in WT muscles with loading. B: control mdx muscles had increased YAP labeling compared with control WT muscles. However, no discernable increase was observed in mdx muscles with loading. Filled arrowheads indicate increased YAP nuclear occupancy, which includes central nuclei in both control and loaded mdx muscles. Open arrowheads indicate nuclei with less YAP occupancy. Scale bar = 25 μm. Magnified image, scale bar = 5 μm. Exposure time, brightness, and other fluorescent microscopy parameters were fixed and not altered between genotypes throughout experiments.

