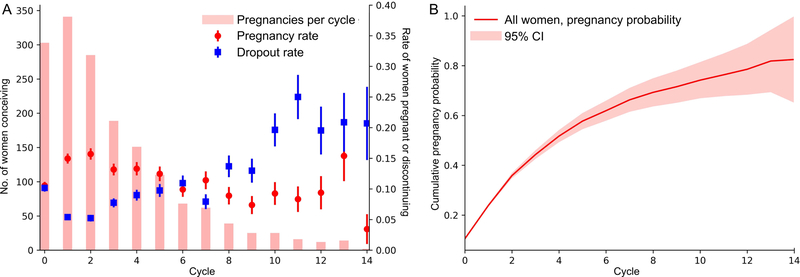
Figure 1.
(A) Conceptions per cycle (bars, left axis), pregnancy rates per cycle (red) and dropout rate per cycle (blue). Error bars indicate one standard deviation. (B) Kaplan-Meier estimate of cumulative pregnancy rate and 95% Confidence Interval per cycle. The observed peak in dropout rates around cycle 11–12 corresponds to the 1-year renewal of subscriptions.

