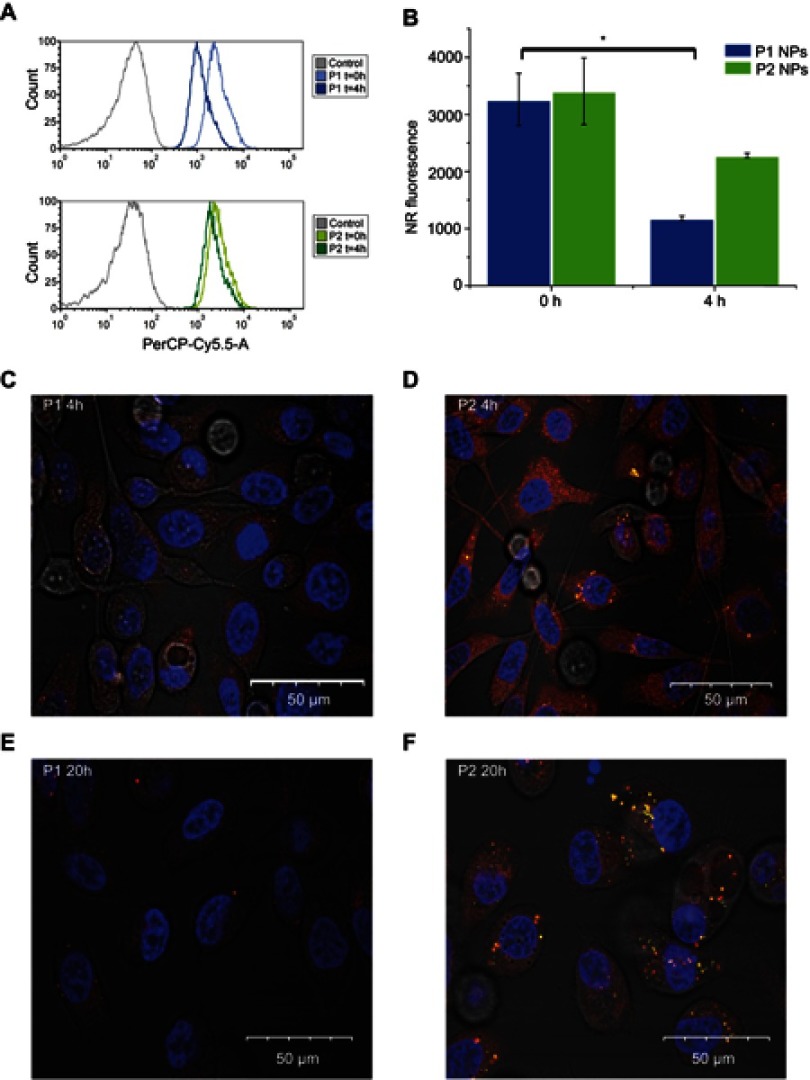
Figure 3.
Flow cytometry and confocal microscopy images. Histograms show NR total fluorescence after 0 hr post-chasing (light blue/light green) and NR quenching in PC-3 cells 4 hrs post-chasing (dark blue/dark green) with P1 NPs (A; top panel) and P2 NPs (A; bottom panel). Grey curves indicate cells without fluorescence. Mean total NR fluorescence in PC-3 cells after 2 hrs chase with NR-loaded NPs 0 and 4 hrs post-chase (B). Confocal images of PC-3 cells after incubation with NR-loaded P1 NPs (left panel) and P2 NPs (right panel) for 4 (C, D) or 20 hrs (E, F) post-chasing. Error bars show SD. Asterisk indicates statistical significance obtained by one-way ANOVA and Tukey’s multiple comparisons post-hoc test. *P<0.05 (n=3).

