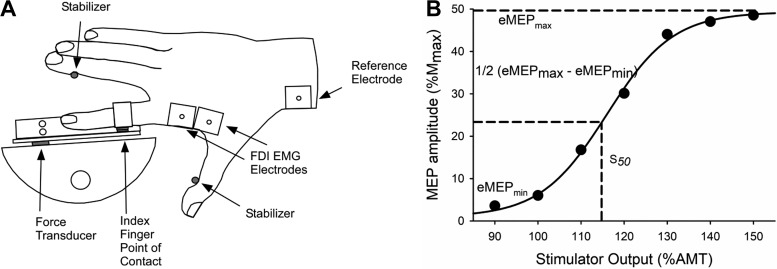
Fig. 1.
A: experimental setup of the first dorsal interosseous (FDI) experiments. EMG, electromyography. B: mean motor evoked potential (MEP) amplitudes of 10 stimulations at each stimulator intensity [% active motor threshold (AMT)] to obtain a stimulus-response curve for a young male participant. The stimulus-response curve was fitted with a 4-parameter sigmoidal function to generate an estimate of the minimum MEP (eMEPmin), maximum MEP (eMEPmax) and the stimulator intensity that elicited an MEP response midway between the eMEPmin and eMEPmax (S50). Mmax, maximum compound muscle action potential amplitude.

