Fig. 3.
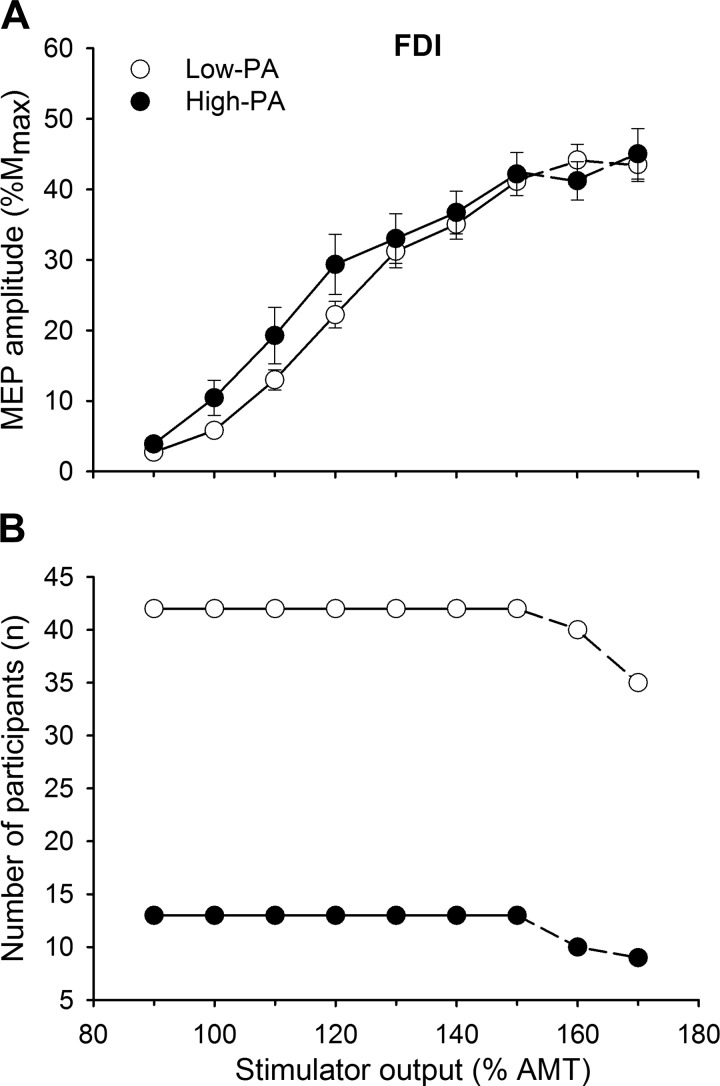
A: stimulus-response curves of the motor evoked potentials (MEPs) from the first dorsal interosseous (FDI) in low- and high-physical activity (PA) participants. MEP [% maximum compound muscle action potential amplitude (%Mmax)] responses did not differ between low- and high-PA participants irrespective of age and sex. Values are means ± SE. Statistical analysis was performed (repeated-measures ANOVA) for intensities between 90% and 150% of active motor threshold (AMT) (solid lines). Data at 160% and 170% AMT (dashed lines) were not included in the analysis because the number of participants declined. B: the number of participants included at each intensity decreased for intensities >150% AMT for both low- and high-PA participants because 1) a clear plateau in the MEP amplitude had already occurred and/or 2) the maximum stimulator output was reached.

