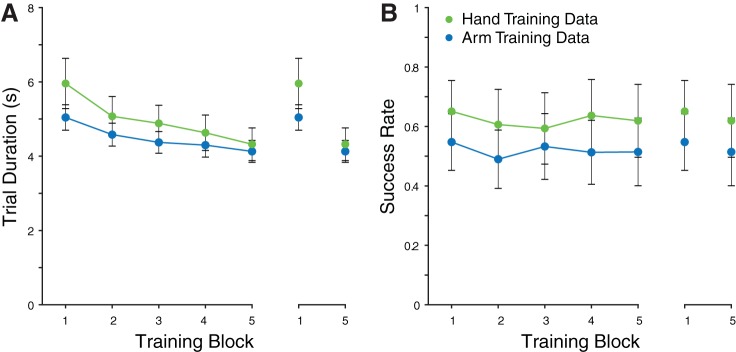
Fig. 3.
Training data. A: mean trial durations for hand and arm training groups. Inset on right shows comparison between the first and final blocks of training for each group. B: error rates for training blocks. Inset on right shows comparison between the first and final blocks of training for each group. Error bars are SE.

