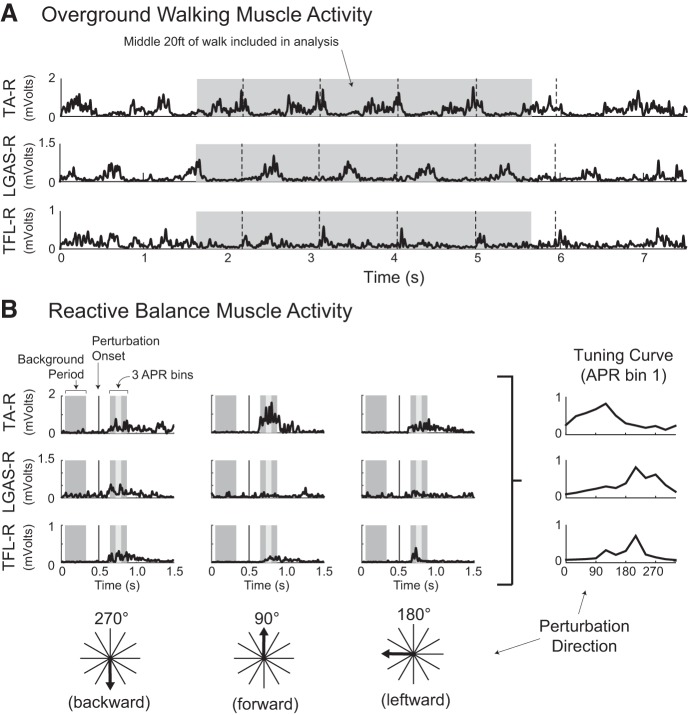
Fig. 1.
Example processed electromyography (EMG) from select muscles during overground walking and reactive balance. A: muscle activity for walking was recorded while participants walked overground at their self-selected speed for at least 3 trials over a 25-ft walkway. Dashed lines represent right heel strikes. For each trial, only data from the middle 20 ft of the 25-ft walkway were analyzed (represented by shaded region) to avoid the effects of gait initiation and termination. Data from all trials for a subject were concatenated before motor module extraction to form an m × t data matrix, where m is the number of muscles and t is the number of time points across all trials. B: muscle activity for reactive balance was assessed through ramp-and-hold perturbations in 12 evenly spaced directions. Left: responses to backward, forward, and leftward perturbations are illustrated. EMG responses occurred ~150 ms after perturbation onset (denoted by vertical lines). Mean EMG activity was calculated during a background period before the perturbation and during three 75-ms time bins during the automatic postural response (APR; shaded regions). Right: tuning curves of mean muscle activity from perturbation responses as a function of perturbation directions for the first APR bin. Before motor module extraction, the tuning curves were assembled to form an m × t data matrix (3 trials × 12 directions × 4 time bins = 144). TFL-R, tensor fascia lata; LGAS-R, lateral gastrocnemius; TA-R, tibialis anterior.

