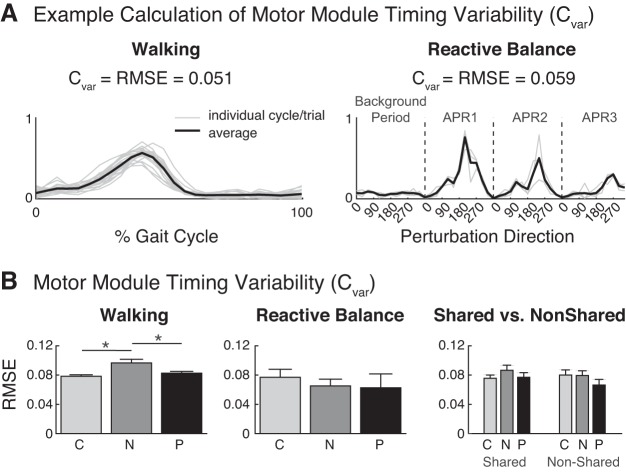
Fig. 4.
Motor module timing variability. A: example motor module recruitment timing and calculation of module timing variability (Cvar). For walking (left), Cvar was calculated as the root mean square error (RMSE) of the timing curve across gait cycles. For reactive balance (right), Cvar was calculated as the RMSE of the timing curve across perturbation directions (12 directions) and time bins [4 time bins: background and automatic postural response (APR) 1, APR2, and APR3]. Gray lines represent individual gait cycles for walking or trials for reactive balance. B: Cvar during walking (left) was increased in the nonparetic leg (N; n = 8) compared with both the paretic (P; n = 8) and control legs (C; n = 16). No differences were identified between legs during reactive balance (middle). No differences were identified between modules that were shared across the two behaviors compared with those that were recruited in only one of the behaviors (right). *P < 0.05.

