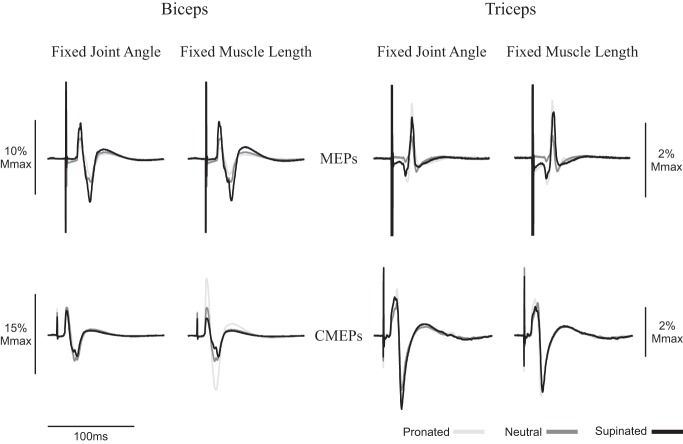
Fig. 2.
Average of 10 motor evoked potentials (MEPs) and 10 cervicomedullary motor evoked potentials (CMEPs) of the biceps and triceps brachii during rest of a representative individual. Black lines, dark gray lines, and light gray lines correspond to supinated, neutral, and pronated measurements, respectively. Traces are normalized to the average of 3 M waves elicited during the same conditions. Mmax, maximum M wave.

