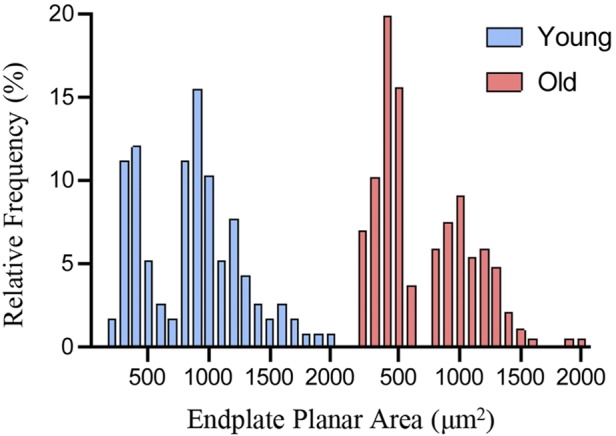
Fig. 6.

Bimodal distribution of endplate planar areas in young and old diaphragm muscle (DIAm). Frequency histogram shows two peaks in the relative distributions of neuromuscular junction endplate planar area of young and old DIAm (young: n = 116; old: n = 185).
