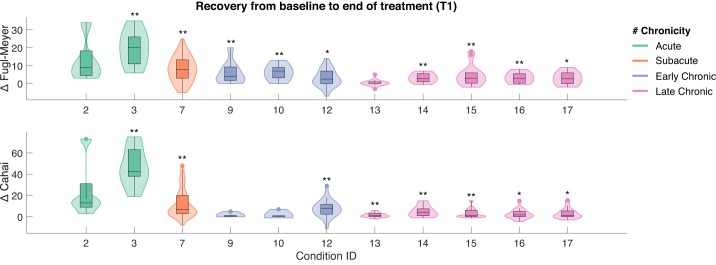
Fig. 1.
Effect of Rehabilitation Gaming System (RGS)-based treatment from the start (baseline) to the end of the treatment (T1). Impact measured on upper limb motor function in the Upper Extremity section of the Fugl-Meyer scale (UE-FM; top) and performance in Instrumental Activities of Daily Living (iADLs) captured by the Chedoke Arm and Hand Activity Inventory (CAHAI; bottom). The effect represents a change in each scale from the start to the end of the treatment. Notice that the horizontal axis refers to the RGS conditions listed in Table 1 and follows the same order. Shaded areas indicate the data distribution color coded according to the chronicity of stroke patients participating in each rehabilitation condition: acute (green), subacute (orange), early (blue), and late (purple) chronic stage. *P < 0.05, **P < 0.01.

