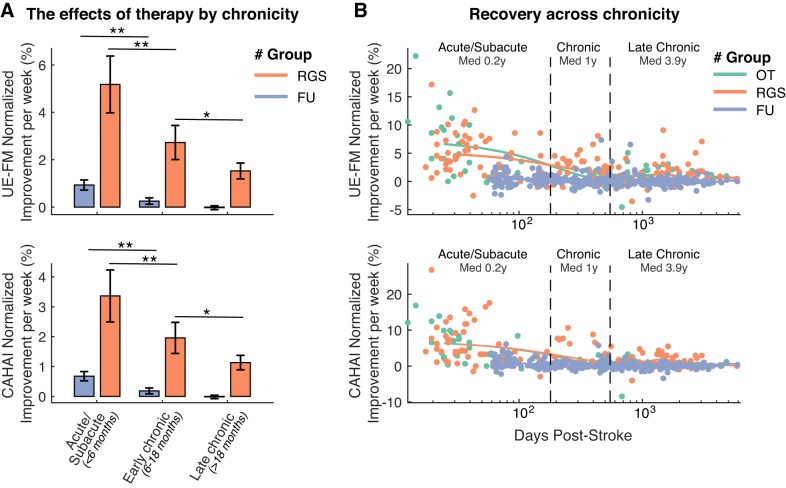
Fig. 2.
A: averaged normalized improvement rates per week after the Rehabilitation Gaming System (RGS)-based treatment and at follow-up (FU) for Upper Extremity section of the Fugl-Meyer scale (UE-FM; top) and Chedoke Arm and Hand Activity Inventory (CAHAI) scales (bottom) by patient’s chronicity at the time of the evaluation. The number of observations is indicated within or above each bar. *P < 0.05, **P < 0.01. B: comparison of the RGS, occupational therapy (OT), and FU measures of normalized improvement rates per week for UE-FM (top) and CAHAI (bottom) scales, by patient’s chronicity at the time of the evaluation. Solid lines indicate the average estimates based on the Whittaker smoothing algorithm (Eilers 2003). Vertical dashed lines indicate the limits of the 3 chronicity categories.

