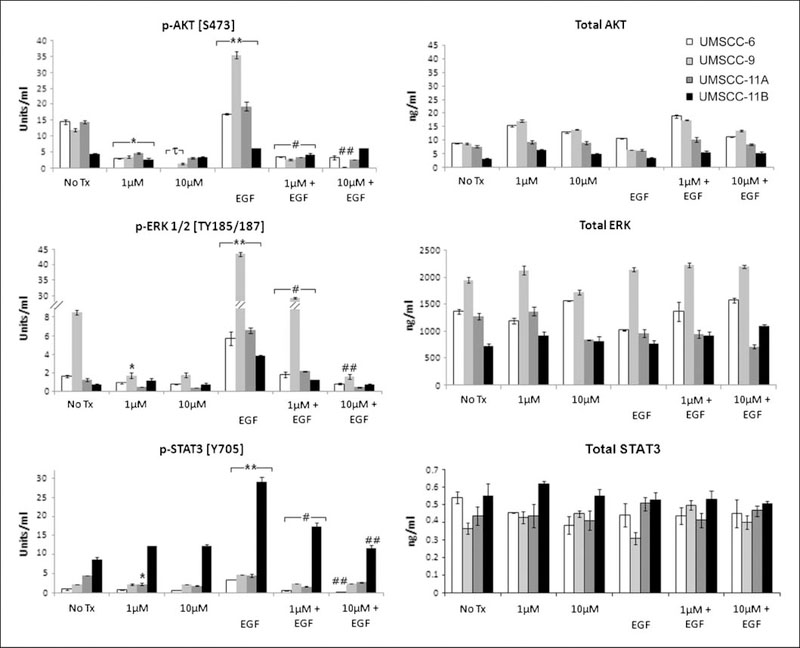
Fig. 3.
Gefitinib effects on phosphorylated and total proteins of signal pathways downstream of EGFR. UMSCC cells were treated and the whole cell lysates were harvested the same way as indicated in Fig. 2.The phosphorylated and total proteins were quantified using ELISA and the data were calculated from triplicates from one of repeated experiments with the mean plus SD. The statistical differences are shown for comparisons with NoTx controls (*), with 1 μmol/L gefitinib (τ), EGF treated with NoTx conditions (**), EGF treated with 1 μmol/L gefitinib and EGF-treated conditions (#), and between different doses of gefitinib when both treated with EGF (##), P < 0.05 (Student’s t-test).

