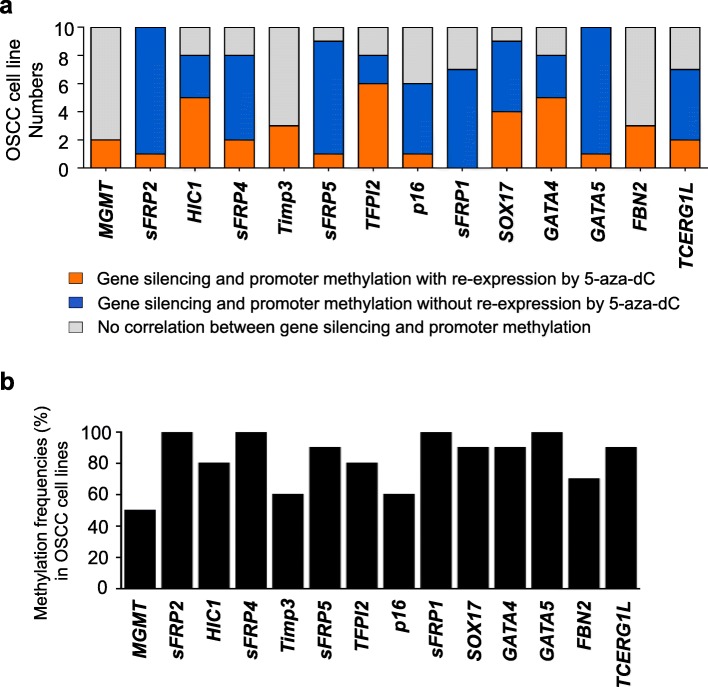
Fig. 1.
Correlation between transcriptional expression and the promoter hypermethylation of tumor suppressor genes in OSCC cell lines. a Summarized results based on the RT-PCR and MSP results of 14 tumor suppressor genes in 10 OSCC cell lines (Ca9-22, HSC4, OSC20, SAS, SCC25, HN22, YD10B, YD38, YD9, and HSC3). The correlation between transcriptional expression and promoter hypermethylation was categorized by the following three criteria: (1) genes are silenced by promoter hypermethylation with re-expression by 5-aza-dC treatment (indicated in yellow), (2) genes are silenced by promoter hypermethylation without re-expression by 5-aza-dC treatment (indicated in blue), and (3) genes are not correlated between gene expression and promoter methylation (indicated in gray). b Methylation frequencies of TSGs in 10 OSCC cell lines by MSP analysis

