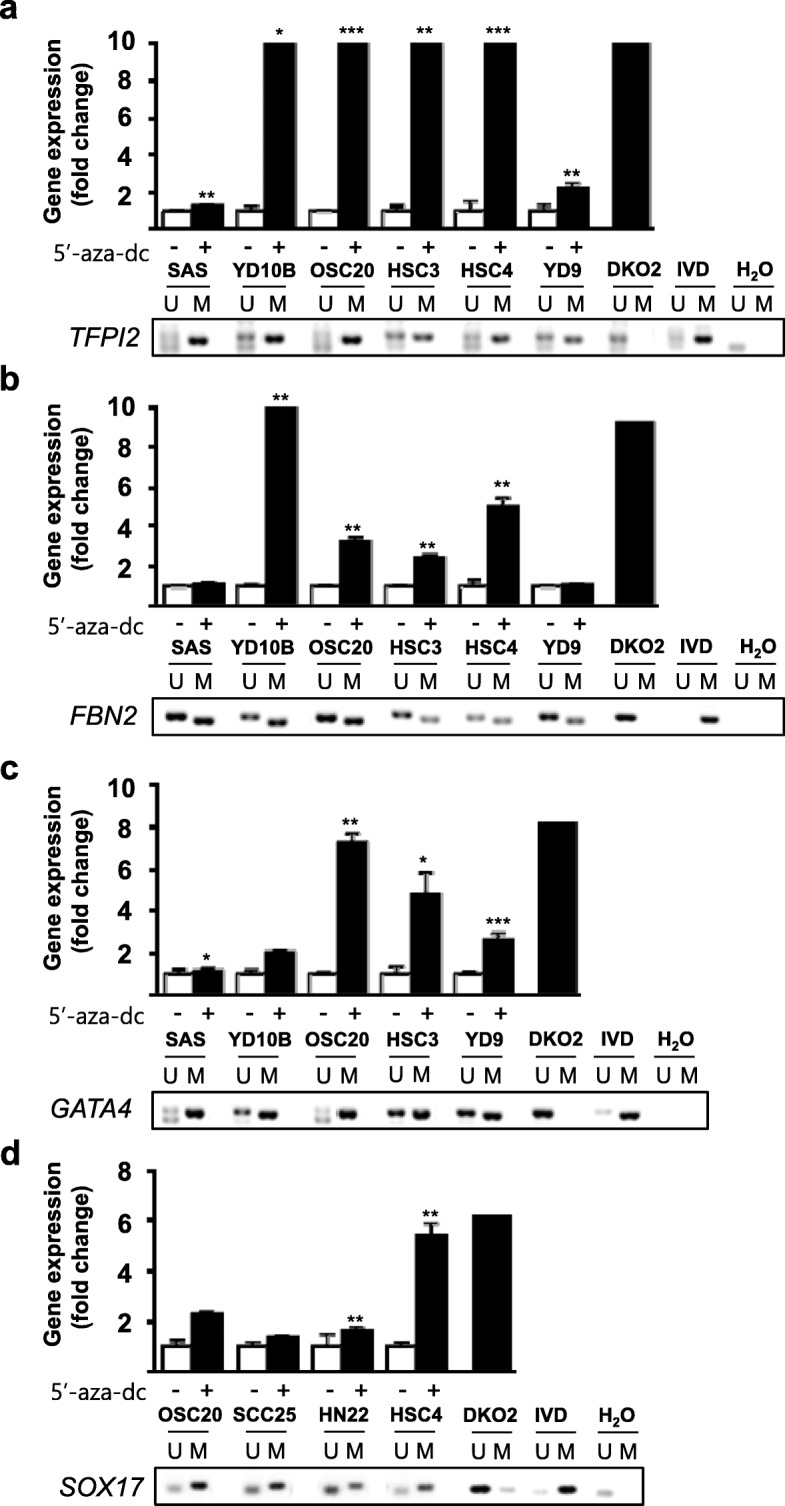
Fig. 2.

a–d Epigenetic inactivation of TFPI2, SOX17, GATA4, and FBN2 in OSCC cell lines. The graph displays the expression analysis of four genes after 5-aza-dC treatment. Real-time RT-PCR analysis was carried out to assess four TSG expression levels in OSCC cell lines before and after treatment with 5 μM 5-aza-dC for 72 h. DNA methyltransferase 1 and 3b knockout HCT116 cells (DKO) were included as positive controls. Asterisk indicates a significant increase in gene expression after 5-aza-dC treatment (p < 0.05). The expression levels of genes were internally normalized to the expression levels of GAPDH, and the normalized expression for each gene before 5-aza-dC treatments was set to 1. Gel pictures describe the methylation analysis by methylation-specific PCR (MSP). PCR products recognize unmethylated (U) and methylated (M). DKO cells were used for the unmethylated control. IVD = in vitro methylated control; ddH2O = water control containing no DNA
