Fig. 3.
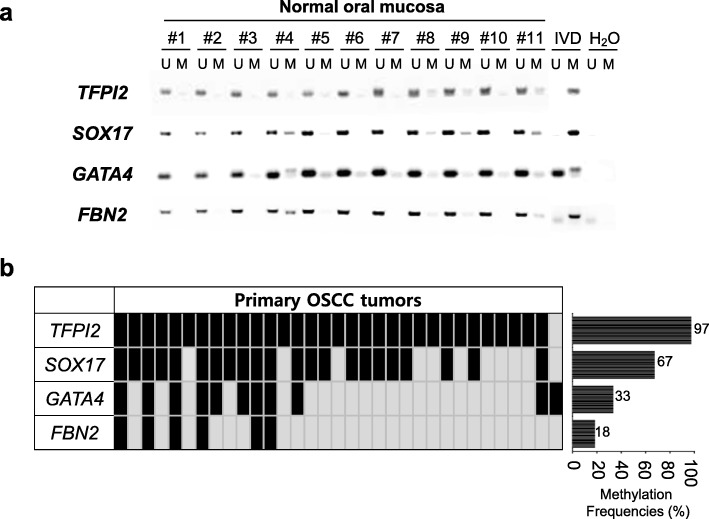
Epigenetic inactivation of TFPI2, SOX17, GATA4, and FBN2 in normal oral mucosa and OSCC primary tissues. a Methylation status of TFPI2, SOX17, GATA4, and FBN2 in normal oral mucosa (n = 11) and b the methylation frequency of the four genes in OSCC primary tissues (n = 33). M = methylation signal; U = unmethylated signal; IVD = in vitro methylated DNA; ddH2O = water control without DNA. The bar graph shows the MSP results of all primary samples

