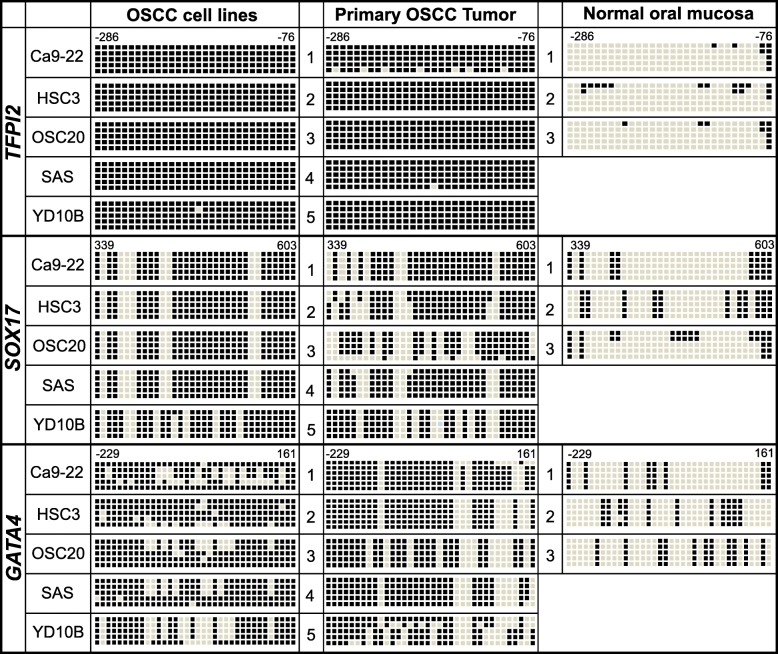
Fig. 4.
Bisulfite sequencing analyses of the CpG islands in the TFPI2, SOX17, and GATA4 gene promoter regions. Representative bisulfite sequencing analyses were performed for all three genes in representative OSCC cell lines (Ca9-22, HSC3, OSC20, SAS, and YD10B), OSCC primary tumors (n = 5), and normal oral mucosa (n = 3). The location of CpG sites (TFPI2: upstream region from − 286 to − 76; SOX17: exon 1 region from + 339 to + 603; and GATA4: upstream region from − 229 to + 161) relative to the transcription start sites (TSSs) of exon 1. Each box represents a CpG dinucleotide. The black boxes represent methylated cytosines, and the white boxes represent unmethylated cytosines

