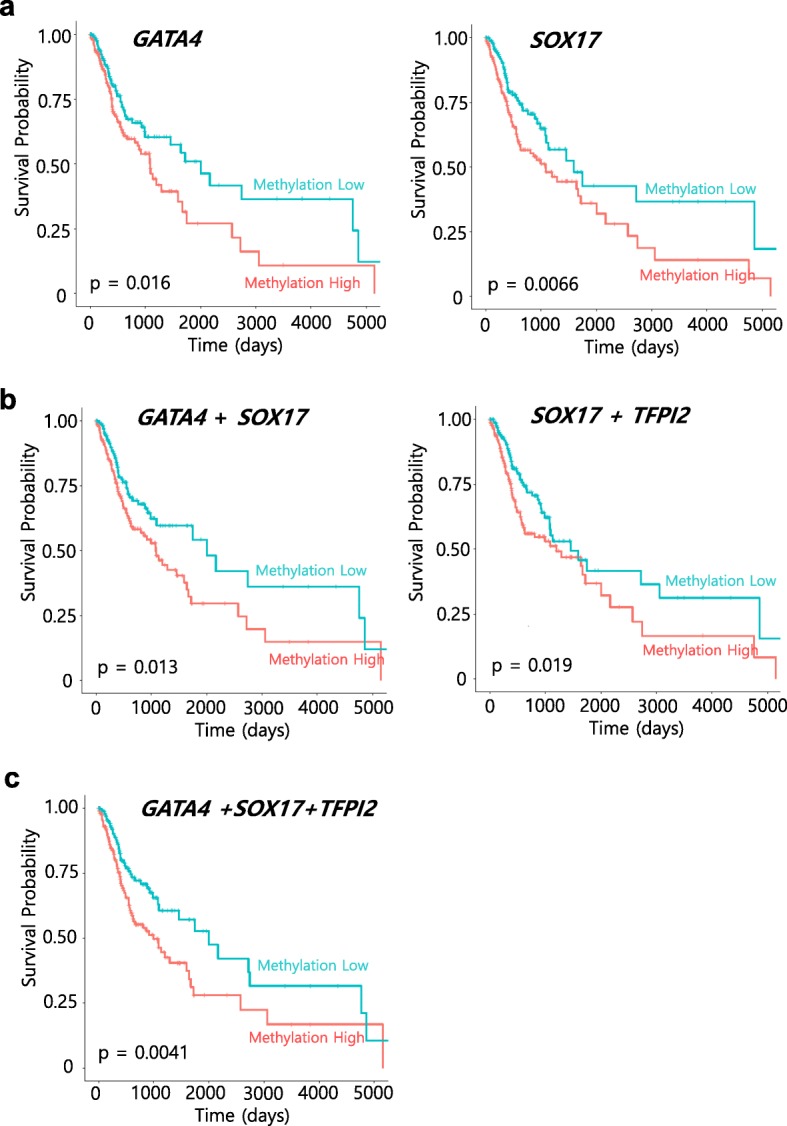
Fig. 6.

Kaplan–Meier survival curves for the 344 patients with OSCC from TCGA HNSCC cohort according to the methylation status of the three candidate genes. Overall survival for a GATA4 (cg24910352 located on gene body) and SOX17 (cg04672706 located on promoter region), respectively. b Combination of GATA4 and SOX17 genes methylation (left) and TFPI2 (cg22441533 located on promoter region) and SOX17 genes methylation (right). c Combination of TFPI2, GATA4, and SOX17 genes methylation. Probe positions were annotated using the UCSC genome browser. Clinical information of patients with OSCC (n = 344) were divided into two groups (methylation high group; orange line, n = 172; methylation low group; blue line, n = 172) according to their methylation status (β-values) on TFPI2, SOX17, or GATA4. A probability of < 0.05 (log rank test *p < 0.05) was considered to represent a statistically significant difference
