Fig. 2.
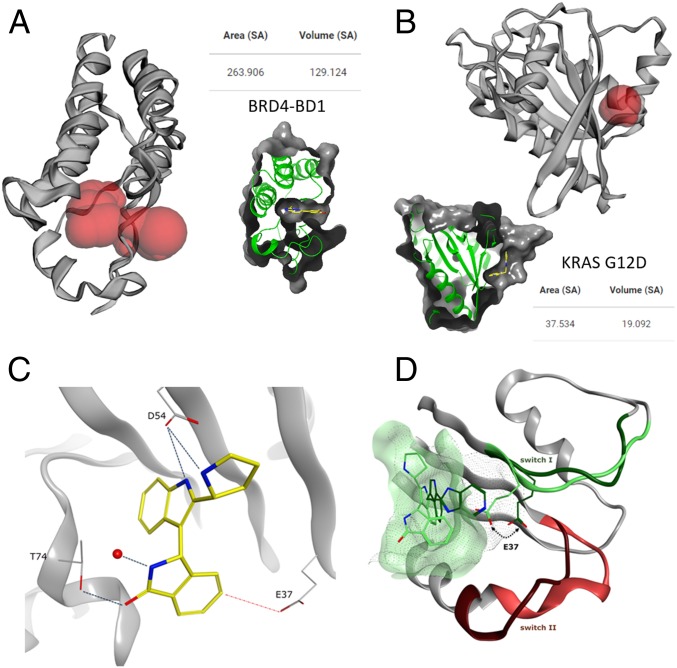
Analysis of protein pockets and X-ray structure of 15 in GCP-KRASG12D. A Computer Atlas of Surface Topography of proteins (48) analysis of pockets in proteins for calculating the solvent-accessible surface area (Area SA) and volume (Volume SA) with a radius probe of 1.4 Å showing differences in pocket size for (A) BRD4-BD1 (PDB ID code 5M39) as an example of a highly druggable pocket and (B) KRAS G12D (PDB ID code 6GJ5) with a very small volume. Calculated pockets are shown in red. Insets show ligand binding in the respective pocket, for comparison reasons. (C) Polar interactions formed by 15 to T74, D54, and a conserved water. The ideal position of E37 for introducing a further polar interaction is highlighted with the red dotted line (PDB ID code 6GJ5). (D) Comparison of SI/II-pocket in GDP (PDB ID code 4EPV) and GTP-KRAS showing the significantly reduced pocket size in GTP-KRAS. The switch I and switch II regions are colored dark green and dark red in GDP-KRAS and light green and light red for GTP-KRAS, respectively.

